View activity by domain

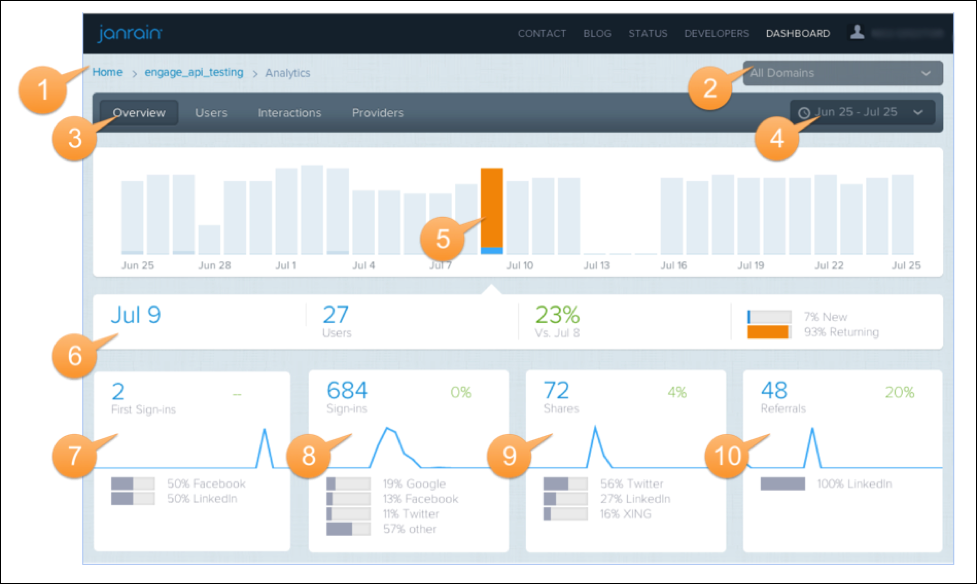
The Analytics Overview page shows recent changes in activity metrics.
-
The navigational breadcrumb allows customers to easily return to the property list (Home) or the property overview page (property name).
-
The Domain list allows customers to filter their analytics view by the domain their users log into.
-
The navigation bar contains links to other Analytics sections and reports.
-
The date range picker.
-
The users bar chart is a measure of the unique users signing in. By clicking on a single bar (which could be an hour, day, week, or month, depending on the current time view), customers can see a snapshot of all analytics metrics for that period of time, reflected in the cards below.
-
This area shows the selection date, unique user count for that period, change in unique user count vs. the previous period from the one selected, and the percent of users that are new vs. returning.
-
First Sign-ins shows the breakdown of unique users signing in or registering via Social Login for the first time. The blue number indicates the raw number of new users in that period with the percentage change from the previous period in the top right. The sparkline shows the trend of first user sign-ins, broken down by hour if viewing a single day. When larger periods are selected, the sparkline is based on larger periods. Below the sparkline is a breakdown of providers for first sign-in users for that period.
-
Total sign-in events for the period (total of new, returning, and repeat user sign-ins).
-
Total share events for the period (non-unique).
-
Total referral visits for the period (non-unique). These referrals are not necessarily linked to shares occurring in the same period.
Updated over 1 year ago
