Schedule data delivery for upgraded Dashboards
This article applies to the following Customer Insights roles: Viewer; Developer
The same scheduling options available with legacy Dashboards are available with upgraded Dashboards; the primary difference between the two types of Dashboards lies in how those scheduling options are packaged. For example, when you click the Options icon in an upgraded Dashboard you won’t see an menu option labeled Schedule; instead, that option has been renamed Schedule delivery in the upgraded Dashboard:

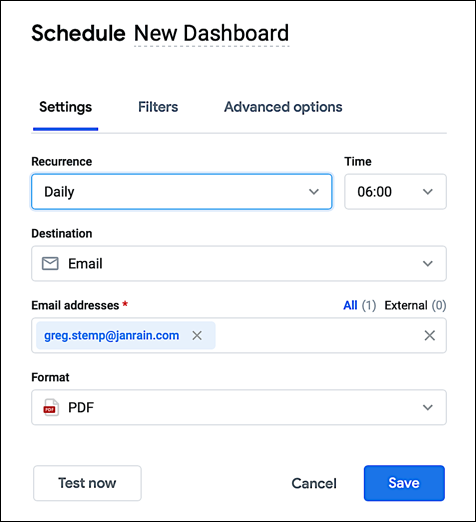
Similarly, the scheduling dialog looks very different in the upgraded Dashboard:

We won’t run through all the available options in detail in this section of the documentation; that’s because most of those options have been detailed in the legacy Dashboards article. Instead, what follows is a quick look at each option and what it does:
- The Settings tab
- The Filters tab
- The Advanced Options tab
The Settings tab
Options available under the Settings tab include:
-
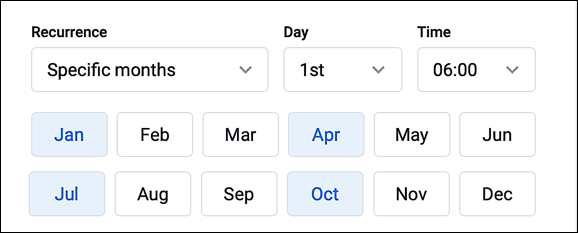
Recurrence. Indicates how often (i.e., daily, weekly, monthly) the report should be sent. Note that the upgraded Dashboard offers one recurrence option (Specific months) not available with the legacy Dashboard. This option enables you to do things like schedule a report to be sent out on the first day of each quarter (January 1, April 1, July 1, October 1):

-
Time. Time of day (based on a 24-hour clock) when the report is sent. By default, the schedule time is based on your local time zone (as defined in your user profile). To base report time on a different time zone (i.e., to use Eastern time instead of your local Pacific time), configure the Delivery timezone setting on the Advanced options tab.
-
Destination. Indicates how you want the report sent. The only option available is Email.
-
Email Addresses. Email addresses of the people the report should be sent to; to send the report to multiple people, separate their email addresses by using commas. Note that recipients don’t need a Customer Insights account: you can send the report to anyone who has an email address.
-
Format. Indicates the format you want to use for the report. Options include PDF, Visualization(which sends the report as a .PNG file), and CSV Zip file (which creates a separate comma-separated values file for each visualization on the Dashboard).
The Filters tab
The Filters tab allows you to configure any of the filters available on the Dashboard; when the report is sent, the report query is first re-run using the configured filter, and the resulting report displays data based on thew filtered query.
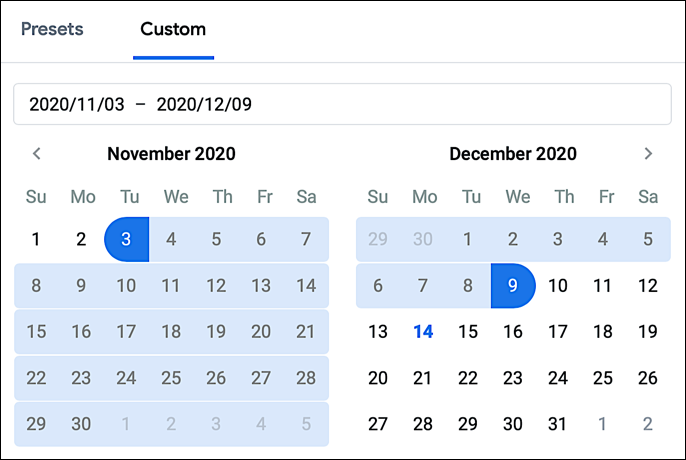
For example, suppose you have a datetime filter attached to a Dashboard and, by default, that filter is set to show the number of user registrations that have occurred in the past week (Last 7 Days). As shown in the preceding screenshot, the Filters tab enables you to change this default value; as a result, your report can be configured to show registrations that occurred in the past two weeks (Last 14 Days) or in the past 30 days or in the past year. If you click Custom, you even configure a much more exacting timeframe:

In other words, by default your report shows user registrations that occurred in the past 7 days. If you change the filter value to Last 30 Days, the report will show user registrations that occurred in the past 30 days. Etc., etc.
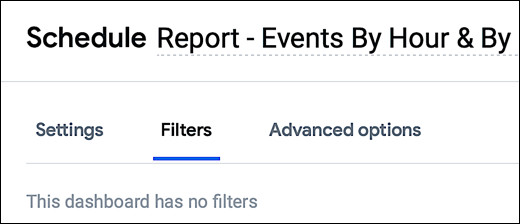
If there aren’t any filters associated with a Dashboard then the Filters tab will look like this:

The Advanced Options tab
The advanced options include:
-
Custom Message. Enables you to add a custom message to the email that accompanies the report.
-
Run schedule as recipient. When selected, the same report isn’t automatically sent to all recipients. Instead, for each user the Dashboard query is re-run as if the query was being run by the email recipient. Depending on the data included in the report, and depending on the access rights granted to the user, that means that some recipients could receive different reports than others.
Note that this option won't be available if your recipients list includes anyone who doesn't have a Customer Insights account. That's because users without Customer Insights accounts don't have permission to run queries.
-
Include links. When selected, a link to the actual Dashboard is included in the email. Customer Insights users who have access to the Dashboard can click the link and view the Dashboard instead of (or in addition to) the emailed report.
-
Expand tables to show all rows. When selected, ensures that all the rows in any Dashboard tables (including rows accessible only by scrolling the table) are included in the report. Otherwise the report shows only those rows that displayed without scrolling.
-
Arrange Dashboard tiles in a single column. When selected, displays visualizations in a single column instead of replicating the exact look of the original Dashboard (which might include visualization arranged side-by-side).
-
Paper size. Enables you to specify the paper size to be used if you print the PDF file. By default, Customer Insights selects a paper size that fits the size and layout of the Dashboard, with no regard to printing.
-
Delivery timezone. Enables you to specify the time zone used for scheduling report deliveries. By default, Customer Insights uses the time zone configured in your user profile (click your user profile icon and then click Account to verify your default time zone). For example, if your default time zone is America – Los Angeles then scheduling your delivery for 6:00 AM means the report is sent at 6:00 AM Los Angeles time. However, suppose you change the time zone for this schedule to America – New York. In that case, the report will be sent at 6:00 AM New York time (3:00 AM Los Angeles time).profiles_by_gender.csv
Updated over 3 years ago
