Create conditional alerts
This article applies to the following Customer Insights roles: Viewer; Developer
To begin with, we should emphasize that Customer Insights was never intended to be a full-fledged monitoring and alerting system. Customer Insights is for data analysis, and not for monitoring and alerting.
So now that we've told you that Customer Insights is not a monitoring and alerting system, let's explain how to use Customer Insights as a monitoring and alerting system.
Yes, we know: that's not what Customer Insights was intended for. As it turns out, however, for certain things, and under certain conditions, you can use Customer Insights to query for, and to alert you about, anomalous occurrences on your website (either good or bad). It might not be the ideal tool for this, but it works, and – as you're about to see – it works very well.
What is a conditional alert?
In the software world, a "conditional statement" is the way developers refer to an if-then statement: if X is true, then do Y. There's nothing magical, or even technical, about that; we use conditional statements all the time in real life. If the door is locked, then ring the doorbell. If the lawnmower won't start, then fill the gas tank. If – well, you know how these things work.
We can set up similar if-then scenarios in Customer Insights thanks to two things: 1) our ability to query for a specific set of data: and, 2) our ability to schedule an email to be sent (or not to be sent) based on the results of that query. Admittedly, that explanation might not explain very much. But that's fine; after all, that's why we're going to walk you through the following scenario:
Let's assume that you have a website where, every hour on the hour, you expect X number of new users to register. (For our purposes, it doesn't matter what X is equal to.) Has an hour ever gone by without a new registration? Yes it has. But each time this happened it was due to a problem of some kind: users tried to register during that hour, but couldn't. In other words, an hour without a registration usually points to some sort of hardware/software/network snafu. Because of that, you'd like to be notified any time an hour goes by without someone registering on the site.
So how can Customer Insights help us in a case like this? It can help in two ways. First, Customer Insights lets us create a Look that can return the number of users who have registered in the past hour. That's the if part of our conditional statement: if no users have registered in the past hour…. As for the then part, Customer Insights enables us to send an email based on the results of that query: then send an email alert to the following people. In other words:
If no users have registered in the past hour, then send an email alert to the following people.
That's a pretty cool little trick, and we're about to explain how you pull this off.
Step 1: Create a Look
To create a Look that can be used with a conditional alert, start by completing the following steps:
-
From the Explore menu, click the name of the Explore that will provide the data for the Look.
-
In the left pane, expand Event Fact and then click Count Entity Creates:
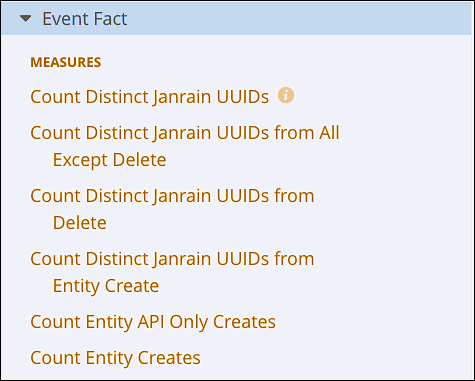
This adds the Count Entity Creates measure to your query. ("Entity creates" is simply the way Akamai refers to new user registrations.)
-
Expand Time Stamp Date and then click Hour:

Doing this adds the Hour dimension to the query, and provides a way for you to group the returned registration data by the hour of the day (e.g., between 1:00 PM and 1:59 PM) when the user registered. For the alert we're about to create, grouping registration events by the hour they occurred is crucial.
-
In the left pane, expand API Client****Dim and then click API Client Name:
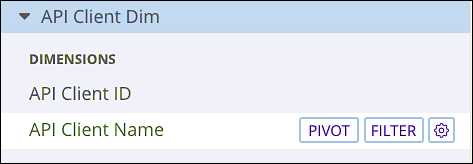
Adding the API Client Name dimension serves two purposes. First, it enables you to identify which API client failed to register any users during the past hour. In addition to that, it provides a way for you to filter only on the API clients of interest. For example, you will always have at least one API client – application owner – that is rarely (if ever) used to register users. Because application owner never registers users, it will always report back 0 registrations . As a result, this one API client will always trigger the alert. Filtering out application owner, as well as any other API clients that are unlikely to register users, helps to minimize these "false alarms."
At the moment, your query should look like this:

Although you don't have to do this, at this point you might want to run the query and verify that it does return data, sorted both by hour and by API client:

Assuming that the query works (and the preceding screenshot suggests that it did), the next step is to add some filters. To do this:
-
In the left pane, expand Event Fact, expand Time Stamp Date, and then click the Filter button located next to the Hour attribute:

This adds the Time Stamp Hour filter to the Filters section. For this filter, set the number of hours to 1, then click the hours dropdown and click complete hours:
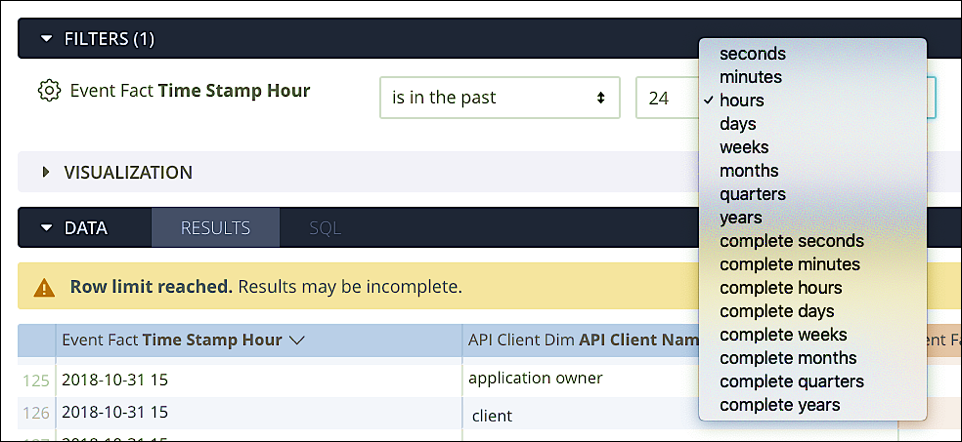
This ensures that Customer Insights will retrieve data for an entire hour (i.e., 60 minutes) and not for a partial hour. For example, if it's currently 1:08 PM, you want to retrieve data from 12:08 PM to 1:08 PM, not from 1:00 PM to 1:08 PM.
-
In the left pane, expand API Client Dim and then click the Filter button located next to the API Client Name dimension:

This adds API Client Name to the Filters section:

In the value field for the API Client Name filter, enter the names of all the API clients you want to monitor. For example, to monitor only for the login**client, enter login client in the filter value field:

Repeat this process until you have entered all the API clients of interest:

If you make a mistake, just click the remove button (the X) located next to the API client you've decided not to monitor after all.
If you run your query now, you should get back registration information (i.e., entity create counts) only for the specified API clients, and only for the past hour:

And that is exactly what we were hoping to get back.
All we have to do now is add one more filter to the query. In the left pane, expand Event Fact and then click the Filter button next to the Count Entity Creates measure:

This adds Count Entity Creates to the Filters section:

We won't set the value of the Count Entity Creates filter at the moment; we'll do that when we create the actual alert. Instead, click the Look Options icon (the icon that looks like a gear) and then click Save as a Look:

In the Save Look dialog box, type a name for the new Look (e.g., Registration Counts for the Past Hour) and then click Save:
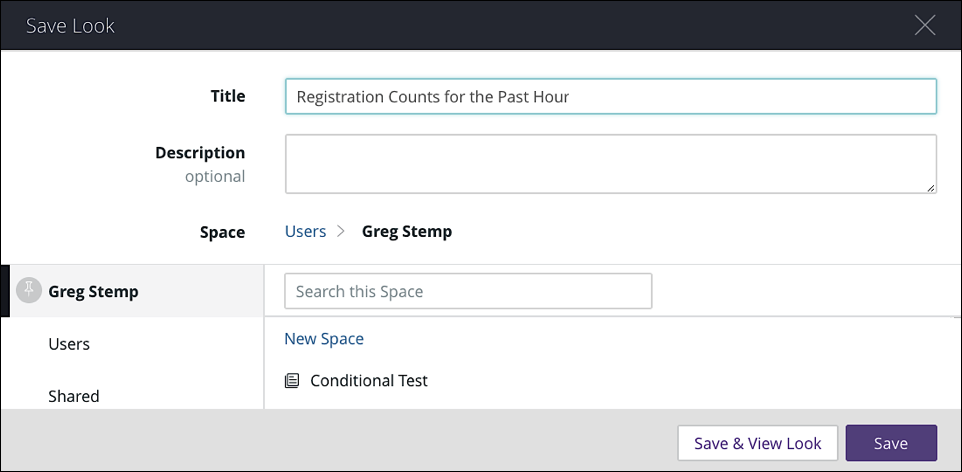
After the Look has been saved, click the resulting link to exit the Explore and open your new Look:

Step 2: Schedule the Look (and create the alert)
We're now ready to create our alert. In the right pane of the Look window, click Create Schedules:

Clicking this link brings up the scheduling dialog box. In this dialog box, we're going to configure several things, including:
- The schedule (alert) name
- The email addresses the alert should be sent to
- A custom message to accompany that alert
- The alert delivery schedule
- A value for the Count Entity Creates filter (yes: finally!)
- The conditions under which this alert should be sent
That's a lot to configure, so let's get started.
We should note that these are not the only options available to you when configuring an alert. Because an "alert" is simply a scheduled data delivery, you have a full suite of options to choose from. See Schedule data delivery for upgraded Dashboards for more information.
Schedule name
The schedule name is optional: by default, the schedule uses the same name as the Look it's based on. However, and depending on your needs, you might want to give your alert a more descriptive title. For example:

That's up to you.
Email addresses
By default, schedules are emailed only to the person creating the schedule. However, you can enter additional email addresses if you would like the alert sent to other people as well:

To add additional email addresses, type those addresses in the email address field (separating individual addresses by using commas) and then click Add. Be sure you click the Add button; if you don't, the email addresses shown in the field will not be added to the alert. The users who will actually receive a copy of the alert are indicated by gray boxes:

If you change your mind, simply click the delete icon (X) on a user box to remove that user from the email list.
Oh, and remember, you can send this data to anyone: the recipients do not need to have a Customer Insights account.
Custom message
When you configured the email recipients you might have noticed a checkbox labeled Include a custom message. If you click that checkbox, you can add a custom message to the alert:

Although a custom message is optional, it might be a good idea to include one. That way, users will know exactly what the emailed alert is for, and what they should do in response to it.
Delivery schedule
It goes without saying that the delivery schedule for this alert depends upon you and upon your business needs. However, because this particular alert checks for registrations in the past hour, it makes sense to schedule the query to run Hourly:

In addition to that, you might have noticed that we placed one constraint on the schedule: we limited the query to running between the hours of 6:00 AM and 6:00 PM. For our hypothetical website, that makes sense: we rarely, if ever, get user registrations outside those hours. That means that, if we failed to include this constraint, we'd probably get alerts at 7:00 PM and at 8:00 PM and at 9:00 PM and …. Getting alerts every hour, even when nothing is really wrong, often defeats the purpose of setting up alerts in the first place.
Filter value
As you might recall, we did not initially set a filter value for the Count Entity Creates measure. That means that, by default, this query will always send an email alert. But that's not what we want: we only want to send an alert if one (or more) of our API clients failed to register any users in the past hour. In other words, we only want to return data if Count Entity Creates is equal to 0:

So why didn't we set this filter value at the same time we created the Look? Well, we could have. However, we wanted to emphasize the fact that filter values can be individually configured for each alert. For example, this alert currently filters on two API clients, login**client and janrain:

However, we could add additional API clients to this alert if we wanted to, even though those clients weren't specified in the original Look. Alternatively, we might want to delete API clients. That way, we could create one alert solely to monitor login**client, and a second alert solely to monitor the janrain API client. By doing this, a single Look can serve multiple alerting purposes.
In addition, we can also change the value of the Count Entity Creates filter, which would then change the nature of what we're monitoring for. At the moment, we're concerned about no registrations in the past hour. However, suppose we're used to seeing 50-60 registrations an hour, but, in the past hour, we've had 1,500 registrations. That could be legitimate (maybe all those registrations are in response to a contest or a special promotion) but it could also be a sign of someone creating a huge number of bogus accounts. The takeaway here is that, in addition to fewer registrations than expected, we might also want to monitor for more registrations than expected. To that end, this filter alerts us if registrations exceed 300 or more in any given hour:

Alert conditions
To explain the alert conditions, let's start by recapping what our query does. We're checking to see if either of our two specified API clients failed to record a registration (Count Entity Creates equals 0) in the past hour. Let's say that both of our clients failed to register a user. In that case, our query would return data like this:

If the janrain client registered a user but login client did not, we'd see this:
 l-28.png)
And if both API clients registered at least one user in the past hour we'd get back, well, nothing:

And that's the key: if we get back results of any kind, that means at least one of our API clients failed to register a user. That's bad, and that's when we want to notified. If we don't get back any results, that can only mean that both of our API clients registered at least one user. That's good, and we do not need to be notified that everything is running as expected. With all that in mind, we want to click Send this schedule and then select there are results:
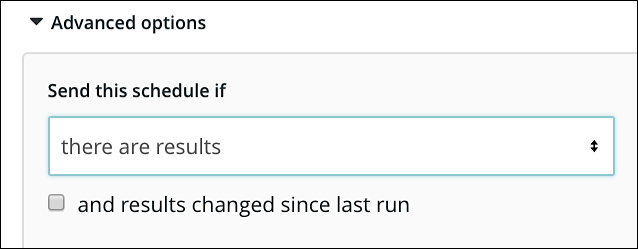
Doing that means that we'll get an email alert only if results are returned (which means that at least one API client failed to register a user). If no results are returned, we won't get an email. Which, again, is exactly what we want to happen.
From here, all we have to do is click Save All and our alert will be scheduled:

And what do we do now? Well, nothing. Instead, we just go about our business. If our API clients continue to register users then the alert will never be triggered. But if something goes wrong and either client fails to register a user then we'll get an email similar to this:
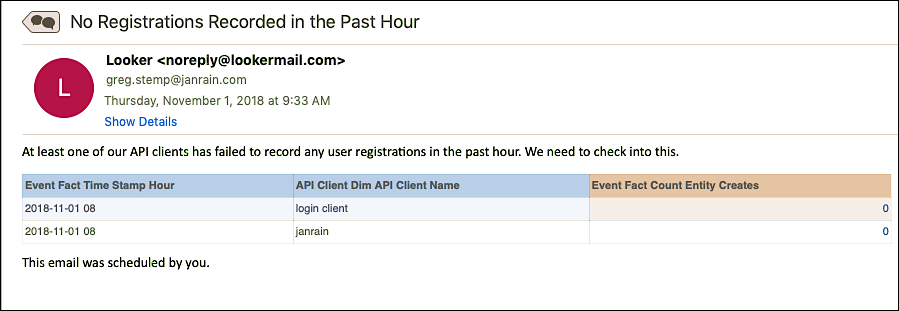
And yes, that is pretty cool. And, needless to say, you're not limited to registrations that took place in the past hour. For example, suppose you've embarked on a campaign to attract more registered users under the age of 25. You could follow this same approach to alert you if a day goes by without any under 25 registering. Alternatively, you could use this approach to verify that users from outside the US are signing in every day. You could – well, again, you get the idea. If it's an event that Customer Insights tracks (and, admittedly, there are a number of important events – like profile updates or password changes – that Customer Insights does not track) you can monitor and report on occurrences of that event. It's not a replacement for, say, a SIEM integration, but, as we just saw, it can still be a very useful tool.
Updated 12 days ago
