Manage data tables
This article applies to the following Customer Insights roles: Viewer; Developer
The Data Section of a Look is “just” the record set returned by the query and “just” the raw data used to construct a visualization. But don’t sell the Data Section short. Not only is there a wealth of data in this section, but there are some interesting things you can do with that data. In particular, this section explores two key tasks:
- Sorting Data in a Table
- Setting Row and Column Limits
Sort data in a table
When you create a table visualization, you can define the field (or fields) that the data sorts on; if you don’t explicitly define a sort order then, by default, Customer Insights sorts your table on the first column, in ascending order (A to Z). This sort order determines the initial appearance of the table. However, when viewing a table you can re-sort the data pretty much any way you want.
To explain how to do this, let’s start by looking at a table that shows postal codes, country names, and city names. In this example, the table is sorted by postal code (note the upward-pointing arrow in the Postal Code column):
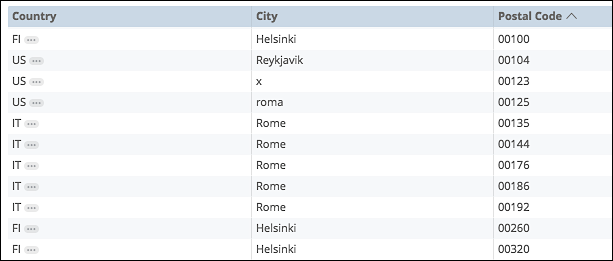
Whether this is the best way to sort the data is irrelevant; after all, we can change the sort order any time we want. For example, to sort by Country, just click the Country column:
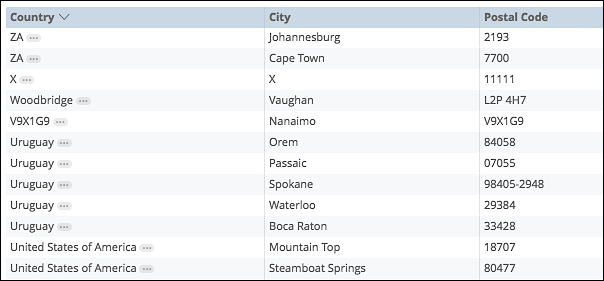
As you can see, any time you sort on a new column that data is sorted in descending (Z to A) order; that explains the downward-pointing arrow in the Country column). If you’d rather see the data sorted in ascending order, just click the Country column a second time.
Now here’s something cool. Sorting data by country is nice, but what would be even nicer is sorting data by country and then by city. Can you do that, can you sort by multiple columns in the same table? You bet you can. To sort by country and then sort by city within each country, do this:
-
Click the Country column to sort by country. If you want to sort in ascending order, click Country a second time.
-
Hold down the Shift key and then click City. To sort by city in ascending order, hold down the Shift key and click City a second time.
The net results will be something that looks like this:
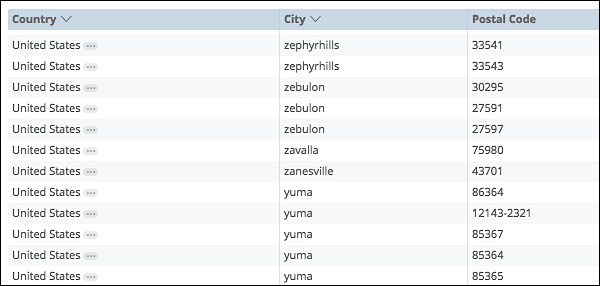
And yes, you can sort by country, by city, and then by postal code:
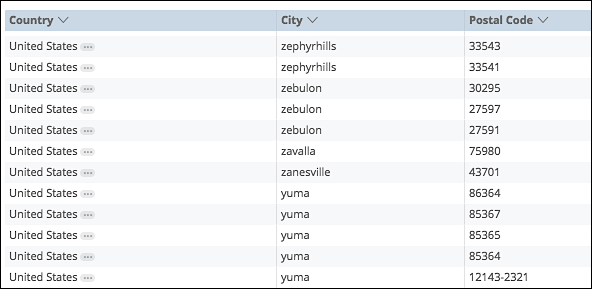
Like we said, pretty cool.
The only thing to keep in mind is that you need to hold down the Shift key for this to work. If you click a column header without holding down the Shift key you’ll sort solely on that column, and any other sorting options you might have set will disappear.
If you fool around with the sort order and then decide you want to go back to the original sort order, there’s a quick way to do that. If you’re viewing a Look, click Reset Look:

That puts the Look back to the way you found it. Just note that it will also remove any filters you’ve applied to the table.
And what if you’re viewing the table in a Dashboard? In that case, click the Options menu for the table and then click Clear Cache & Refresh:
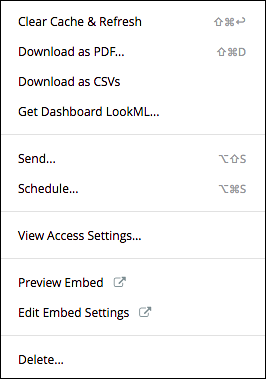
That reloads the Dashboard data and, along the way, reloads the Dashboard itself.
Set row and column limits
Looks always come with a limit on how many rows the query returns (by default, Looks return 500 rows, although the Look developer can make that limit higher or lower). There might be times, however, when you want to see more rows (or fewer rows) than are displayed by default. When times like that arise, you can change the number of rows returned by going to the Data section and modifying the Row Limit field:

For example, here’s a standard visualization:
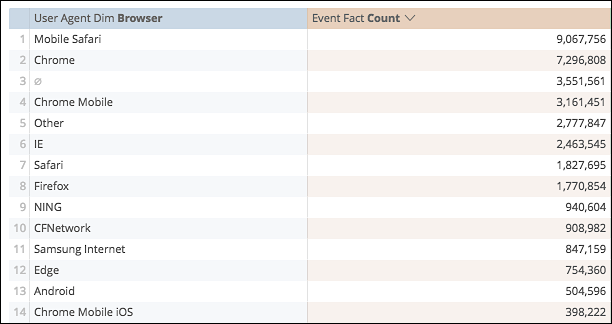
And here’s the same visualization with the row limit set to 5:

If the visualization you’re working with uses a pivot, you can place a similar limit on the number of columns displayed in the table.
Updated almost 4 years ago
