Import SIEM events into Splunk (legacy customers only)
The content on this page deals with a legacy feature of the Akamai Identity Cloud. If you are currently an Identity Cloud customer and are using SIEM event delivery, that feature is still supported. However, if you’re new to the Identity Cloud, SIEM event delivery is no longer available.
Although the Identity Cloud supplies you with SIEM event data, we don’t offer any tools for processing and analyzing that data. To do that, you need to import you data into a third-party SIEM event application such as Splunk or IBM QRadar. In this article, we walk you through the process of importing SIEM event data into Splunk.
Before we begin
To illustrate how event data can be imported into Splunk, we’ll use a small data file with event data like this:
{"id":"4fbfe9f2-6788-4d84-b9f8-2e454a908072","message":{"captureApplicationId":"csz94t3wwngx8gy373zyv8m2xh","captureClientId":"tvp36tcaff5f8upw5t873k9y265agree","entityType":"user","globalSub":"capture-v1://app.datateam.dev.or.janrain.com/csz94t3wwngx8gy373zyv8m2xh/user/5838b155-da40-4972-8ec1-3d51db0bfad4","sub":"5838b155-da40-4972-8ec1-3d51db0bfad4"},"msts":1615501427892,"type":"entityCreated"}And here's a view of that same event that’s a bit easier to read:
{
     "id": "4fbfe9f2-6788-4d84-b9f8-2e454a908072",
     "message": {
          "captureApplicationId": "csz94t3wwngx8gy373zyv8m2xh",
          "captureClientId": "tvp36tcaff5f8upw5t873k9y265agree",
          "entityType": "user",
          "globalSub": "capture-v1://app.datateam.dev.or.janrain.com/csz94t3wwngx8gy373zyv8m2xh/user/5838b155-da40-4972-8ec1-3d51db0bfad4",
          "sub": "5838b155-da40-4972-8ec1-3d51db0bfad4"
     },
     "msts": 1615501427892,
     "type": "entityCreated"
}
Two things to note about our sample file (and about your event data files). First, your data might be in compressed format (e.g., saved as a .ZIP or .GZ file) and might contain multiple data files. If that’s the case, you don’t have to do anything like, say, manually extract the data files. Instead, just point Splunk to the file: Splunk will automatically extract and process all the files in the compressed file.
And what if you don’t have a .ZIP file or a .GZ file, what if you only have a single JSON file to import? That’s fine: just follow the exact same procedure used to import a compressed file.
Second, it’s possible that, depending on the underlying event type, your individual events might contain different fields. Again, that’s nothing to be concerned about: Splunk will work with the fields that are included with the event and won’t worry about the fields that aren’t included with the event. And neither should you.
Importing a SIEM data file
To import a SIEM data file into Splunk Enterprise, complete the following procedure. Keep in mind that this is not the only way to get data into Splunk; there are other (possibly better) ways to import your data files. At the same time, however, keep in mind that this is not intended to be a tutorial on how to use Splunk; instead, it’s designed simply to show you a way to import your data and start processing it.
Picking up where we left off, to import a SIEM data file into Splunk Enterprise, complete the following procedure:
-
In Splunk, click Settings and then click Data Inputs:

-
On the Data Inputs page, in the Local Inputs section, click the + Add New link next to Files & Directories:

-
On the Files & Directories page, click Browse:

-
In the Select source dialog, select the file that contains your SIEM event data and then click Select:

Keep in mind that, if your file is in a standard compressed format (such as .ZIP or .GZ) there is no need to decompress the file: Splunk will automatically extract and process all the data files contained within the compressed file.
-
Because we’re importing a single file (as opposed to constantly monitoring a folder for new files), click Index Once:

-
In the Add Data navigation pane at the top of the screen, click Next:

-
On the Select Source Type page, click Select Source Type, point to Structured, and then click _json to set the file format to JSON:

In the event preview pane, you’ll see the following warning next to the _time field:
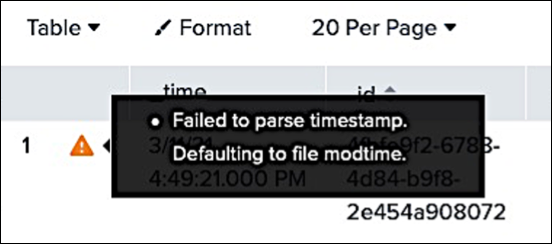
This warning appears because Splunk can’t determine the timestamp associated with your events; that’s due to the fact that the Identity Cloud stores the timestamp in a field named msts (instead of a field named timestamp). For now, you can ignore this warning. At the end of this article, we’ll show you a way to work around the issue.
-
In the Add Data navigation pane, click Next:
-
On the Input Settings page, leave the default settings as-is and then, in the Add Data navigation pane, click Review:

-
On the Review Page, verify that the information is correct and then, in the Add Data navigation pane, click Submit:

-
After a moment or two, the File input has been created successfully page appears. Click Start Searching:

-
Your imported data appears on the New Search page:

Working with event timestamps
As noted in the previous section, timestamps can be an issue when importing Identity Cloud events into Splunk. That’s because the Identity Cloud uses the msts field to store the event timestamp rather than a field named timestamp. As a result, the value shown in the Time field represents the last time that the data file was modified; it does not represent the time the event occurred (that value is stored, in Unix epoch format, in the msts field):

So now what? Well, one way to work around this issue is to modify the default search query that appears at the top of the screen:
source="/Users/gstemp/Downloads/eventdelivery-datateam-dev-or-csz94t3wwngx8gy373zyv8m2xh-1-2021-03-11-22-23-51-d962ca55-d190-4579-940a-82288a98c945.gz" host="sjc-mpktl" sourcetype="\_json"For example, append the following syntax (shown in red) to the end of the default search string:
source="/Users/gstemp/Downloads/eventdelivery-datateam-dev-or-csz94t3wwngx8gy373zyv8m2xh-1-2021-03-11-22-23-51-d962ca55-d190-4579-940a-82288a98c945.gz" host="sjc-mpktl" sourcetype="\_json" **| eval eventTime=strftime(msts/1000, "%m/%d/%Y %H:%M:%S") | table msts, eventTime**Click the Search button, and you'll get back something similar to this:
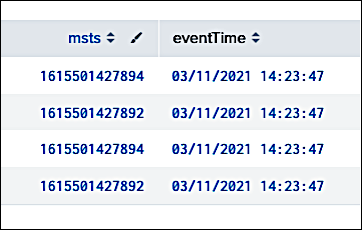
Without going into too much detail, we’ve done a pair of things here. First, we’ve used Splunk’s strftime function to convert msts (the event timestamp in Unix epoch time) into a more human-readable time format. then stored the converted timestamp value in a variable named eventTime:
eval eventTime=strftime(msts/1000, "%m/%d/%Y %H:%M:%S")Second, we’ve asked Splunk to display only the msts and the eventTime fields:
table msts, eventTimeDoing that enabled us to compare the original timestamp to the converted value, and helps us verify that the conversion works. However, displaying just the timestamp data is of little value. Therefore, let’s add to the list of fields to be displayed in our output:
table id, eventTime, message.captureApplicationId, message.sub, typeNote that, because both the captureApplicationId and the subfields are contained within the message field, we need to use “dot notation” to specify the full path to these fields:
message**.**captureApplicationId
In other words, we specify the parent field (message), append a dot (.), and then specify the child field (captureApplicationId).
If we click search now, we’ll get back more detailed information about the event (although, in the following screenshot. we show only a portion of that returned data):

If you’re happy with this output (and this format), you can save the output as a report. The next time you import data, that data can be added to the report, and will automatically be formatted the way you like it:

Updated 3 months ago