View activity for a specified time period
The following reports in the Users section contain data on unique users.
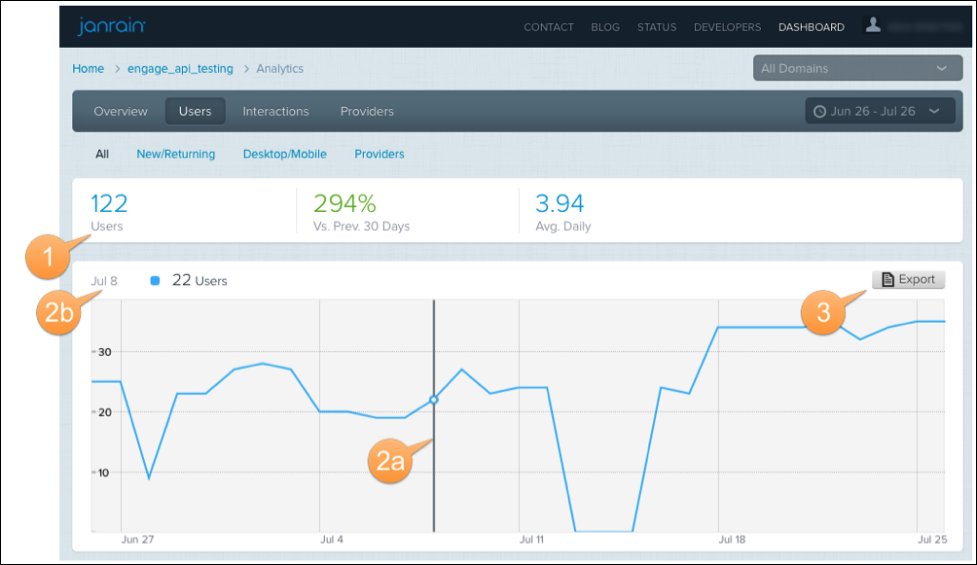
The All report shows all unique users for the selected time range.
-
The main bar shows the total unique user count for the selected period, the change in total users from the previous period, and the average number of unique users signing in for the specified period (in this case, on a daily unit).
-
Hover over the line chart (callout 2a) to display the unique user count for the hovered-over date (callout 2b).
-
Click Export to download a .csv file of the analytics data currently in view.
Users — New/Returning
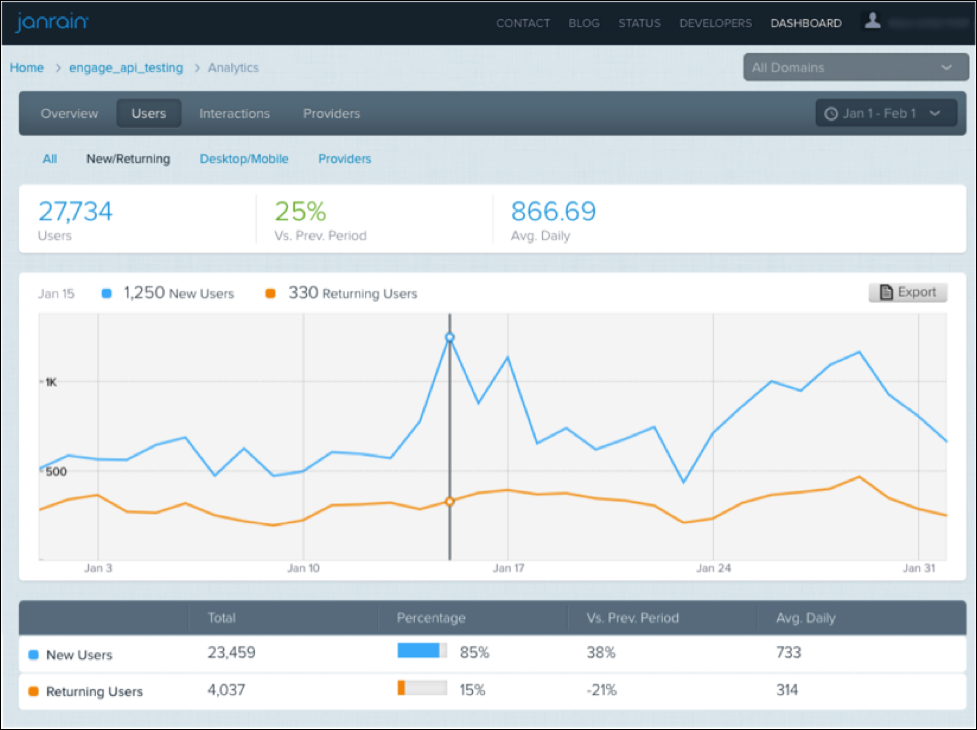
The New/Returning Users report shows a detailed trend of new and returning users. You can toggle the display of a series by clicking on it. For example, if you click on the orange series (Returning Users) it will be removed from the chart.
-
New Users. A new user is a user who was encountered (through a sign-in or authenticated share) for the first time during the report’s time range across all Relying Parties (RPs) and domains for that app unless filtered by domain.
-
Returning Users. A returning user is a user who was first encountered (through a sign-in or authenticated share) on any of the specified RPs and domains prior to the beginning of the current report’s date range.
Remember, as this report counts unique users, a single user is counted only once in the totals, but may appear multiple times in the time series. For example, if a user signed in for the very first time and then for two more times in the first day, and then five times in the second day, that user will be counted once for the date range as a new user but appear as one new user and one returning user for day one and one returning user for day two in the chart lines.
Users — Desktop/Mobile
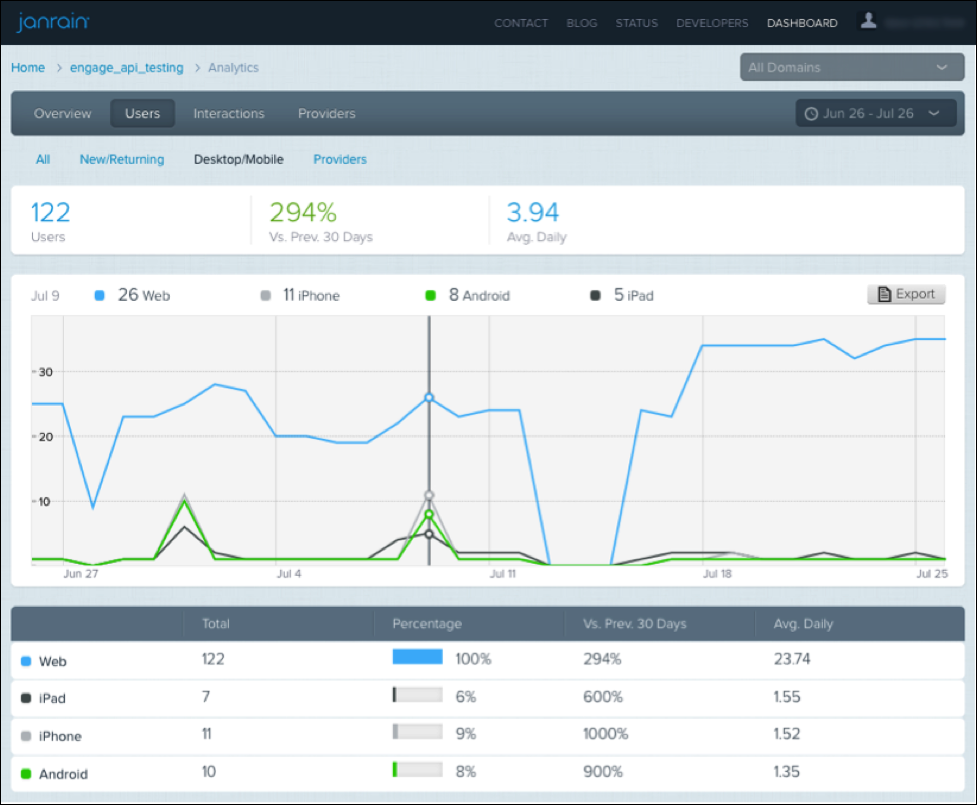
The Desktop/Mobile Users report displays a breakdown of the device users have used to access your app. Like the report above, each series is selectable and can be viewed on the graph or hidden.
Users — Providers
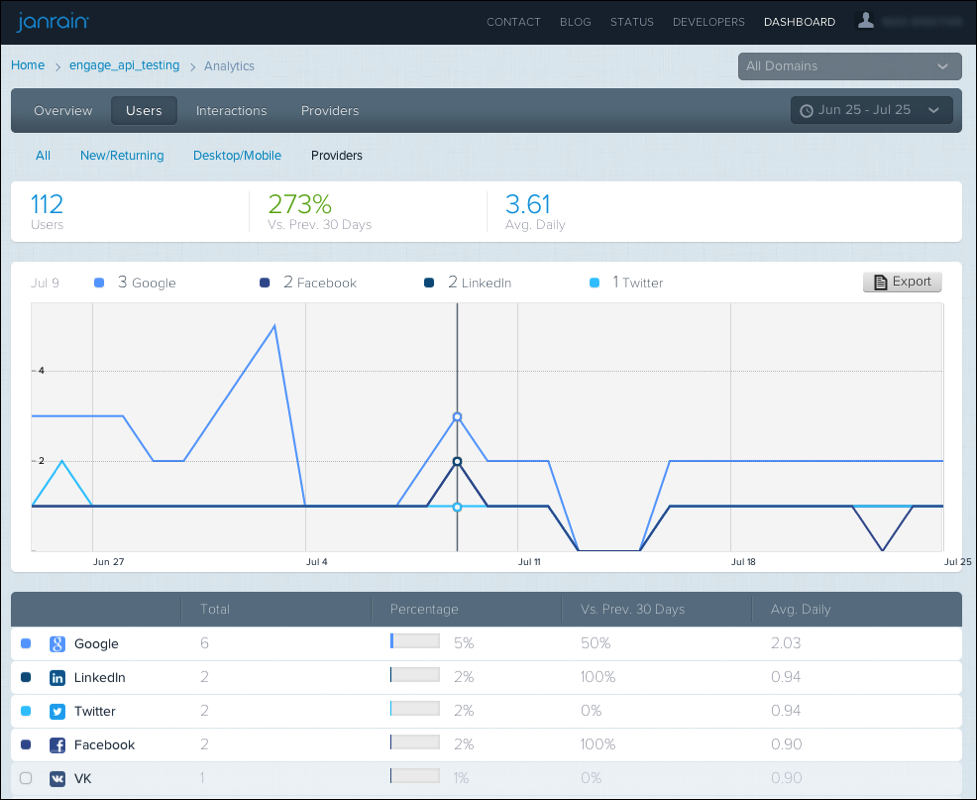
The Providers report displays unique users signing in with their provider of choice. As in the previous reports, each series is selectable and can be viewed on the graph or hidden.
Updated about 1 month ago