Kubernetes Dashboard on LKE
LKE’s Kubernetes Dashboard will be decommissioned in May 2026Following the upstream archival of the Kubernetes Dashboard project, Akamai Cloud will decommission the LKE-hosted Kubernetes Dashboard. This change will occur in May 2026. Once decommissioned, the Kubernetes Dashboard UI will no longer be available for new and existing LKE clusters.
The Kubernetes Dashboard is an open-source web-based user interface designed to be a visual hub for interacting with a Kubernetes cluster, allowing for a more intuitive interface for observing cluster objects, components, containers, applications, and more. While providing an easy way to monitor a Kubernetes cluster and perform health checks, the Kubernetes dashboard additionally provides a means to perform administration tasks, similarly to how one would perform administration through the command line tool kubectl.
LKE non-enterprise clusters provide the Kubernetes Dashboard by default. If you have deployed an LKE cluster, the Kubernetes Dashboard can be accessed through the Kubernetes Dashboard Link that's found in the Cloud Manager. The Kubernetes Dashboard is currently not provided alongside LKE Enterprise clusters.
This guide will be a step-by-step introduction to accessing the Kubernetes Dashboard on LKE through the unique link found in Cloud Manager or the Linode API. Additionally information will provide basic insight into navigating the Kubernetes Dashboard, as well as provide an example for creating and editing resources directly through the dashboard.
Accessing the cluster dashboard
The Kubernetes Dashboard can be found at the top of the cluster's details page. The steps for reaching the dashboard from Cloud Manager's are as follows:
-
Click the Kubernetes link in Cloud Manager's sidebar menu. The Kubernetes listing page appears and you see all of your clusters listed.
-
Select the cluster you wish to access. The Kubernetes cluster’s details page appears.
-
Click the Kubernetes Dashboard link at the top of the page to open the Kubernetes Dashboard for the cluster.

-
To log in to the dashboard, you must enter the cluster's token. This can be accessed from the Copy token link in Cloud Manager or within the kubeconfig file. You can also generate a new token if needed. Enter the token and click Sign in to access the dashboard.
Navigating the cluster dashboard
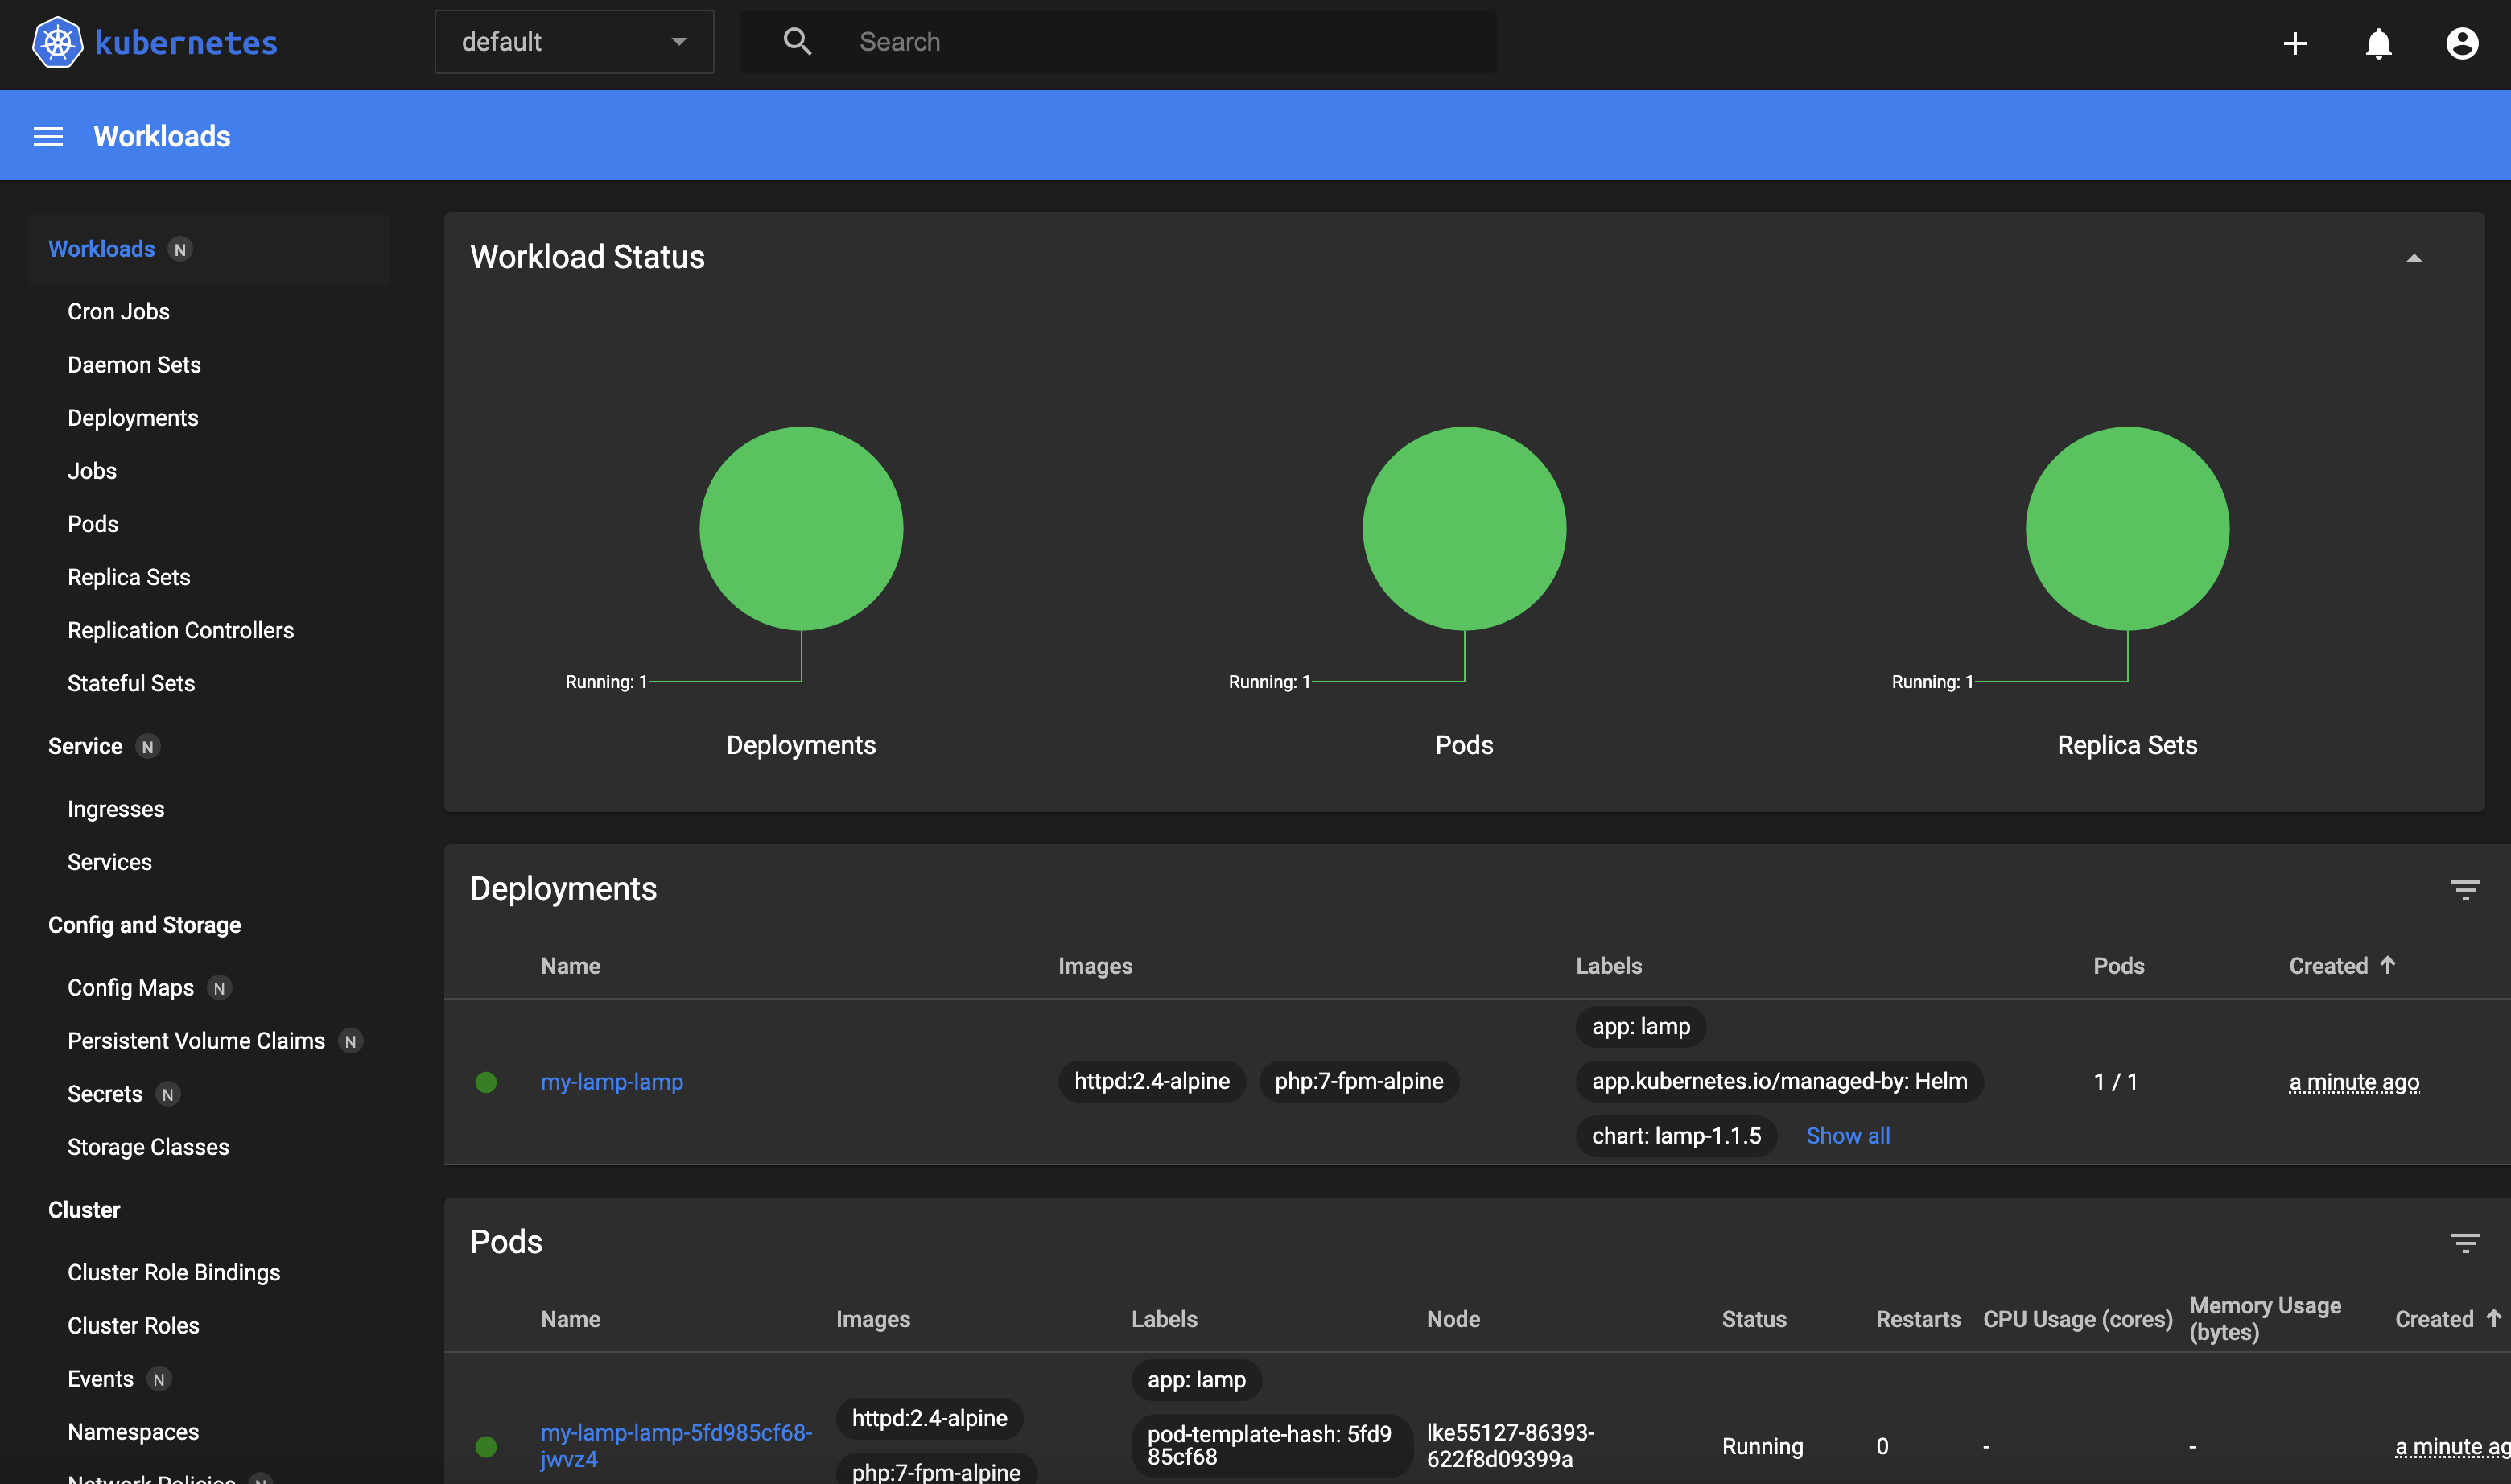
Once logged in to the cluster's Kubernetes Dashboard, Workloads for the default namespace will appear. This page will include information on all Workloads as defined by Kubernetes, and provide a number of options to navigate the dashboard further.

Selecting a namespace
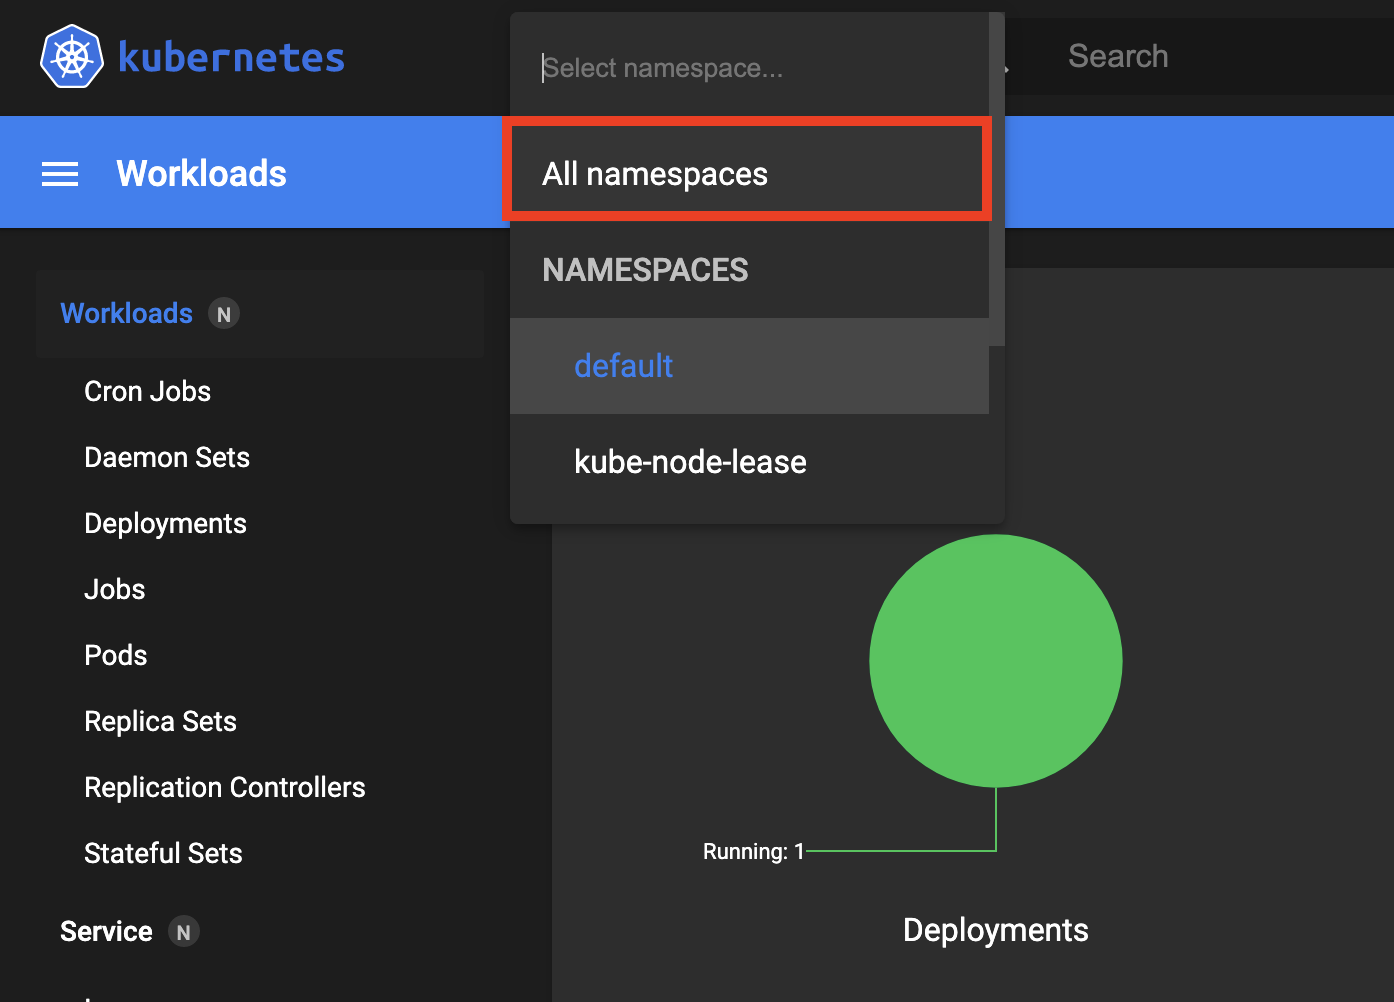
All namespaces the logged in user has access to are listed and selected from the top left of the page using the dropdown menu. Users who prefer not using a set namespace that would instead like to use every namespace at once can select the All Namespaces option. The active namespace can be changed at any time.

Navigating objects and components
Towards the left of the page is a sidebar menu that includes access to similar categories for all other available objects and components, largely as defined by Kubernetes.
-
Workloads: Contains information on applications running on Kubernetes Pods, as well as the controllers that help to most directly manage them.
-
Service: Contains information related to application networking on Kubernetes, primarily in the form of Services and Ingresses.
-
Configuration and Storage: This section includes information related to ConfigMaps, stored Kubernetes Secrets, Storage Classes, and Persistent Volume Claims.
-
Cluster: A more administrator focused look at the Kubernetes cluster, the cluster category contains configuration details related to RBAC, Nodes, Persistent Volumes, Network Policies, and Service Accounts.
By selecting categories and sub-categories within the sidebar menu, users can inspect the Kubernetes configuration similarly in most cases to using the kubectl get command. Selecting the Pods sub-category under the Workloads primary category, will show a table of all running pods by name, namespace, the images they're relying on, Labels applied, the hardware node or nodes they're currently active on, the current status, the Date the Pod was created, and any restarts. Individual Pods can then be selected further to see additional details as if entering the kubectl describe command against a single individual Pod. This same general ruleset applies to all forms of navigation when using the Kubernetes dashboard, though the equivalent kubectl command applied will vary depending on the resource being accessed.
Creating resources
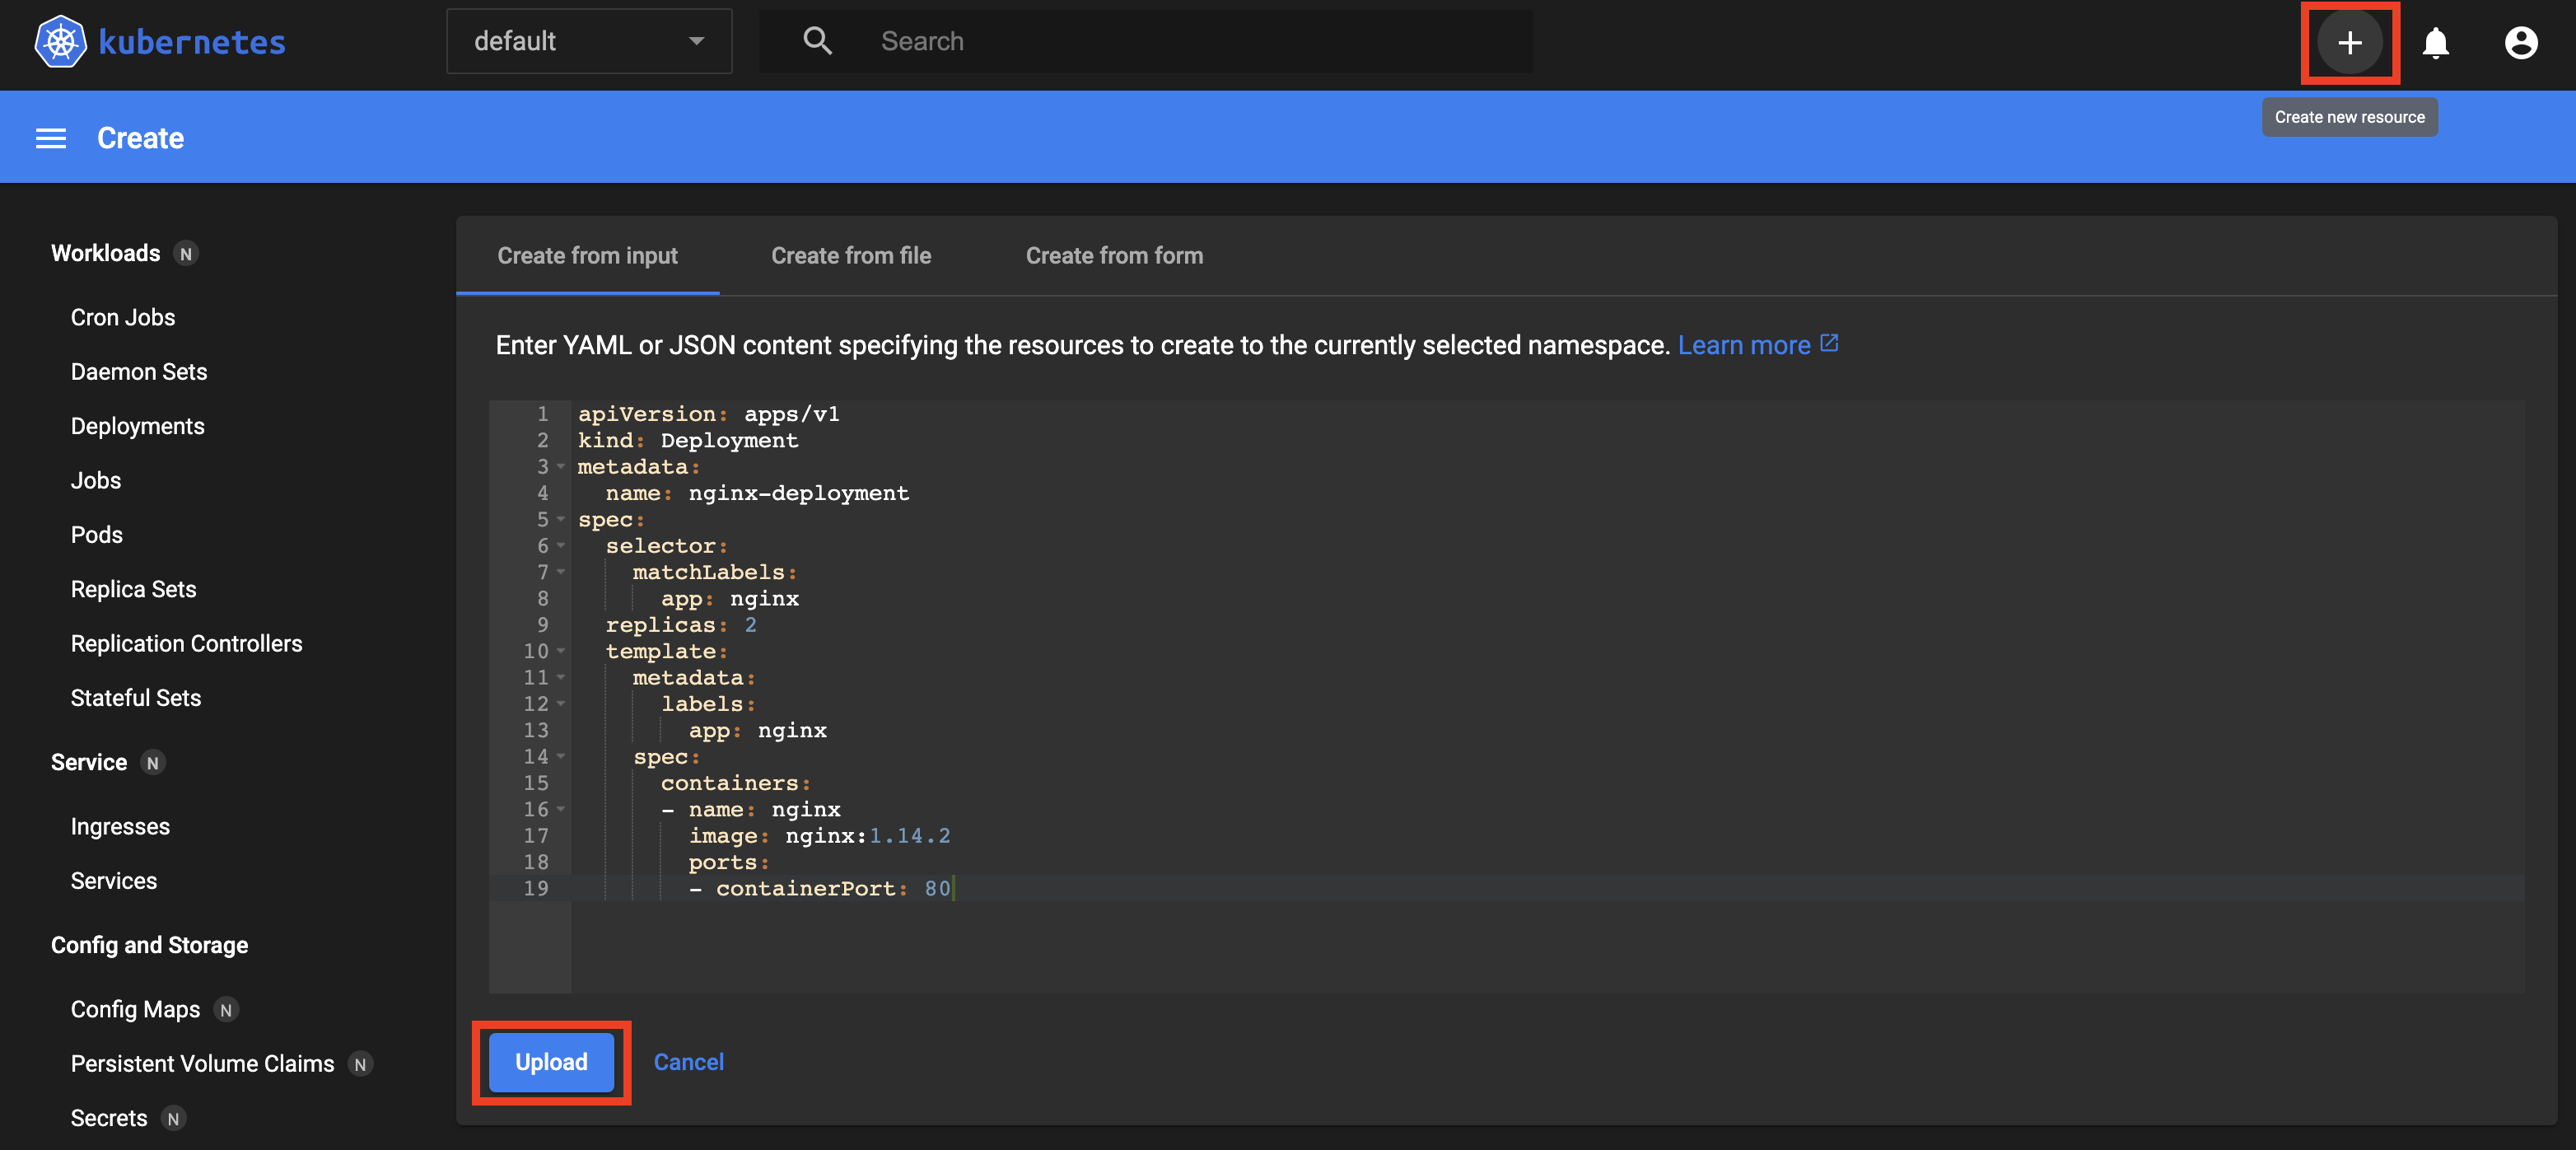
The Kubernetes dashboard additionally allows for the creation of resources directly. This can be completed at any time by selecting the plus icon at the top right of the page. Once completed, users can input YAML or JSON formatted configuration content directly, upload a YAML or JSON file, or create a resource by filling out a form. Once completed, the resource can be created by selecting the upload or deploy option. This is similar to the kubectl create command when working with Kubernetes over the command line.

Editing a resource
After inspecting an object or resource in the highest level of detail, the pencil icon will appear at the top of the page if any edits can be made. Once the pencil icon has been selected, the configuration of the resource can be viewed in both YAML or JSON format, and edited as needed. Once all edits are made, the Update button can be selected to edit the resource as if using the kubectl apply -f command.
Limitations
While the Kubernetes Dashboard is fully featured in all other regards, the CPU and Memory graphs and analytics provided in part bymetrics-server on some Kubernetes Dashboard installations are not included.
As the LKE provided version of the Kubernetes dashboard is hosted and configured separately from cluster nodes, if users need access to CPU and Memory graphs, a separate Kubernetes dashboard installation including metrics-server must be performed, hosted directly on the cluster nodes themselves and configured for external access.
Updated about 2 months ago
