View EAA dashboard
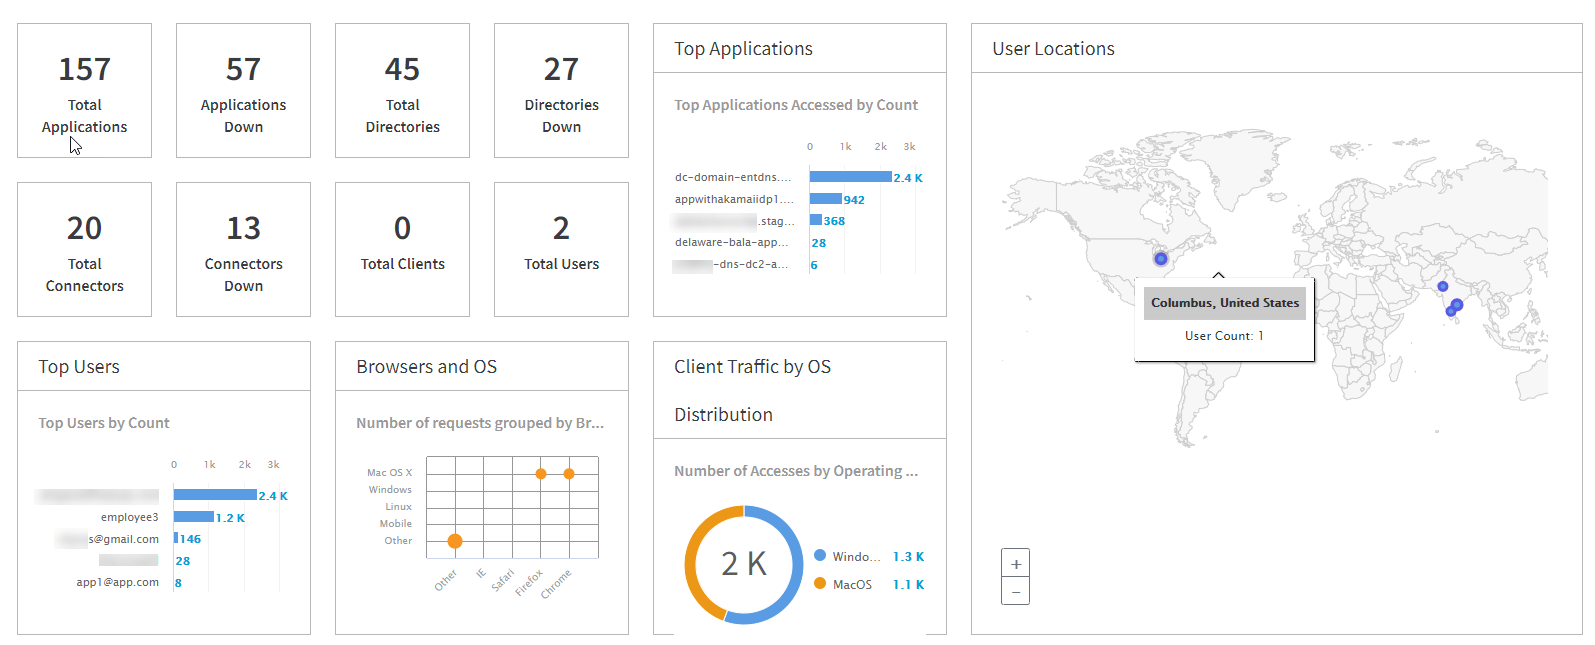
Access dashboard gives you an overview of the number of protected applications and their status, connectors, directory and insight about active users, their IP address, or browser. Use the Enterprise Application Access (EAA) dashboard to monitor the health of connectors, applications, directories, and cloud zones to get applications and user statistics, to list operating systems and browsers used, to check login failures and to view user activity graphs.


- Log in to Enterprise Center.
- In the Enterprise Center navigation menu go to Dashboard > Access Dashboard.
- Select start and end dates, or a predefined time range (from an hour to a year).
The default time range is one day.
Dashboard displays tiles with statistics overview. - Click on the tile for more information.
Detailed reports are available for Top Applications, Top Users, Browsers & OS, Activity, Login Failures, and User Locations.
Dashboard displays statistics on the following data:
-
total number of running applications, directories, and connectors, total number of applications, directories, and connectors that are down, total number of users, and total number of EAA Clients.
-
Top Applications. The top five applications that are most frequently used by your organization.
-
User Locations. The geographical location of all of the users. Click any dot on the map to see more location details (like the application name, the user's name, and the city from where it was accessed).
-
Top Users. The top five users of your organization.
-
Browser & OS. The operating systems used (plotted on the y-axis), and the browsers used (plotted on the x-axis). Hover over a purple dot to see the requests that was made to the EAA application with a combination of a specific browser and OS.
-
Client Traffic by OS. The number of GPA Client running on macOS and Windows devices.
-
Top Client Applications. The top five Cliented applications based on the access count.
-
Login Failures. To help detect any anomalous activity this tile lists the different types of login failures. You can select:
-
Invalid Password. The total login failures due to an incorrect password and when it happened.
-
Invalid Username. The total login failures due to an incorrect user name and when it happened.
-
-
Activity. The total number of unique users, and the total active sessions of all of the users. Hover over the graph to get the user's and active session's statistics on a certain day or time.
-
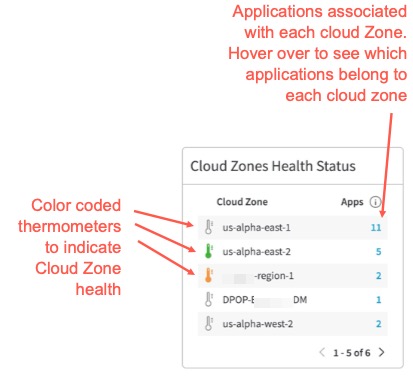
Cloud Zone Health Status. You can check the health status of your different Cloud Zones on EAA Dashboard and know which applications are associated with each of the cloud zones. You must contact Akamai Support to enable this feature.

The colored thermometer indicates the health of the cloud zone as follows:
- Green thermometer. Indicates a low load on the Cloud Zone
- Yellow or Orange thermometer. Indicates a medium load on the Cloud Zone
- Red thermometer. Indicates a high load on the Cloud Zone
- Colorless thermometer. Indicates that the Cloud Zone is unreachable
Adding a custom dashboard
You can create a custom dashboard and add different widgets to it, to monitor different activity.
- Log in to Enterprise Center.
- In the Enterprise Center navigation menu go to Dashboard > Dashboard.
- Select the Add Dashboard icon (
 ) on the top right corner.
 - Dashboard name. Provide a name for the dashboard.
- Click + Select Widgets. Select the different widgets you wish to add to your custom dashboard.
- Click Preview. Check that you can view all the relevant data.
Here's a custom device posture dashboard that has widgets like Tiers, Tags, and different Device Signals:

- Click Save, to save the dashboard.
- After the dashboard appear, select Set as Default, if you want to make your custom dashboard the default one that appears when you log into the portal.
Updated 5 months ago
