Real-time Connector Metrics using Datadog, TrafficPeak, and Amazon CloudWatch SIEM providers
You can use SIEM providers like DataDog,TrafficPeak, and Amazon CloudWatch to monitor, analyze, investigate any health issue, security incidents, and perform data visualization for your EAA Connectors. You can send CPU, Memory, and Network metrics of the EAA Connectors for creating Dashboards for visualization.
It involves these steps:
- Contact Akamai support to obtain the mapping between the Connector GUID and the connector name. The Connector GUID is sent to the SIEM provider.
- Configure the EAA Management Portal to send the metrics to a SIEM provider.
- If you are using DataDog or TrafficPeak, refer to these additional details:
- View the metrics, create graphs, dashboards in DataDog.
- To view the metrics, create graphs and dashboards in TrafficPeak, contact your Account team to have the EAA table to be enabled, including
eaa_metrics.
Send metrics to a SIEM provider
Prerequisite: You must have a connector version greater than 24.03.00.150
You can send different connector metrics like CPU, memory, and network to your DataDog SIEM provider.
Follow this procedure to send these metrics:
- Log in to the Enterprise Center.
- In the Enterprise Center navigation menu, select Application Access > General Settings > Settings > Company Settings.
- Go to the System monitoring SIEMs section.
- Enable Send metrics, to send the connector metrics like CPU, memory and network to your SIEM provider to monitor, investigate issues, and perform data visualization. When you disable this setting, no data is retained or sent to the SIEM provider.
The connector metrics sent to SIEM providers are:
CPU Metrics:
| Metric name | Description |
|---|---|
| cpu.usage_active | Percentage of time spent by CPU doing active work across all the CPU cores. |
| cpu.usage_idle | Percentage of time spent by CPU being idle. |
Memory Metrics:
| Metric name | Description |
|---|---|
| mem.total | Total physical RAM installed on the machine in bytes. |
| mem.available | Amount of memory available in bytes, for new processes without swapping. |
| mem.available_percent | Percentage of RAM available. Calculated as mem.available / mem.total * 100 |
| mem.used | RAM used in bytes. |
| mem.used_percent | RAM used in bytes, expressed as a percentage of total memory. Calculated as mem.used / mem.total * 100 |
| mem.dirty | Memory pages modified in RAM but not yet written to disk, expressed in bytes. |
| mem.mapped | Size of memory mapped files and devices, expressed in bytes. |
Network Metrics:
| Metric name | Description |
|---|---|
| net.bytes_recv | Total bytes received by the interface. |
| net.bytes_sent | Total bytes transmitted by the interface. |
| net.packets_recv | Total packets received by the interface. |
| net.packets_sent | Total packets transmitted by the interface. |
| net.err_in | Total receive errors detected on the interface. |
| net.err_out | Total transmit errors detected on the interface. |
| net.drop_in | Total received packets dropped by the interface. |
| net.drop_out | Total transmitted packets dropped by the interface. |
| net.speed | Latest reported interface speed in Mbits/sec (If unsupported, it is represented as -1). |
- Active SIEM. Select the name of the SIEM provider. Datadog, TrafficPeak, and Amazon CloudWatch are supported for this release. You can also click on the edit SIEM (pencil icon) to edit the SIEM parameters. You can click remove SIEM, to delete the SIEM provider and start another configuration.
- You must provide the parameters needed to connect to the SIEM Server of your choice. The parameters are different for different SIEM providers.
Connect to TrafficPeak
To connect to TrafficPeak SIEM server, provide these parameters:
SIEM type. TrafficPeak
Encryption Token. Provide the token to securely send the connector metrics data to the SIEM provider. You can obtain the encryption token from the Hydrolix
Username. Specify the username you use to login to the server.
Password. Specify the password you use to login to the server.
Connect to DataDog
To connect to DataDog SIEM provider, provide these parameters:
SIEM type. DataDog.
Server. Provide the server hostname of the SIEM provider.
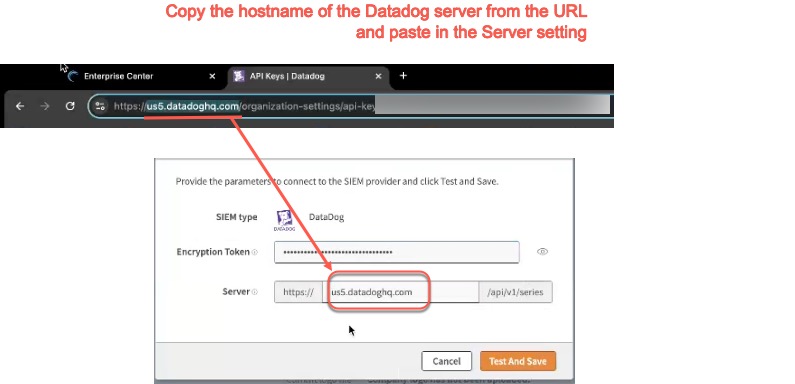
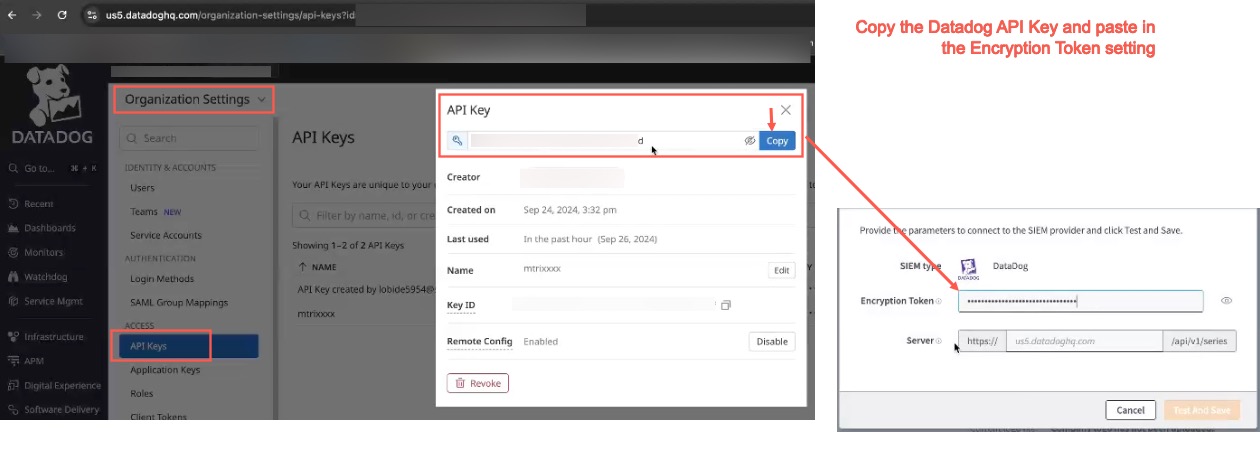
Encryption Token. Provide the token to securely send the connector metrics data to the SIEM provider. You can obtain the encryption token from the API Keys from DataDog. See Add an API key or Client Token in Datadog documentation. You can click on the show encryption token (eye icon) to check if you entered it correctly, in case you have trouble connecting to the SIEM server.
Connect to Amazon CloudWatch
To connect to Amazon CloudWatch SIEM provider, provide these parameters:
Access keys. The Access keys for your Amazon CloudWatch account.
Security Keys. The Security keys for your Amazon CloudWatch account.
Region. Provide the AWS region for which you have access to and for which you want the metrics to be streamed.
Namespace. Namespaces are intended for isolating metrics. It prevents metrics from different applications from being mistakenly aggregated into the same statistics. Provide a unique namespace when creating a subscription to ingest EAA metrics.
Refer to the AWS documentation for more details:
Access/Secret keys AWS documentation
Region AWS documentation
Namespace AWS documentation
Paste the information in the Connect to CloudWatch SIEM server modal:

- Click Test and Save, to test the connectivity. If EAA can communicate to your selected SIEM correctly, changes are saved.
You should be able to receive the EAA Connector metrics in your SIEM provider dashboard to perform diagnosis, data visualization, and troubleshoot any security incidents.
View metrics in Datadog Explorer
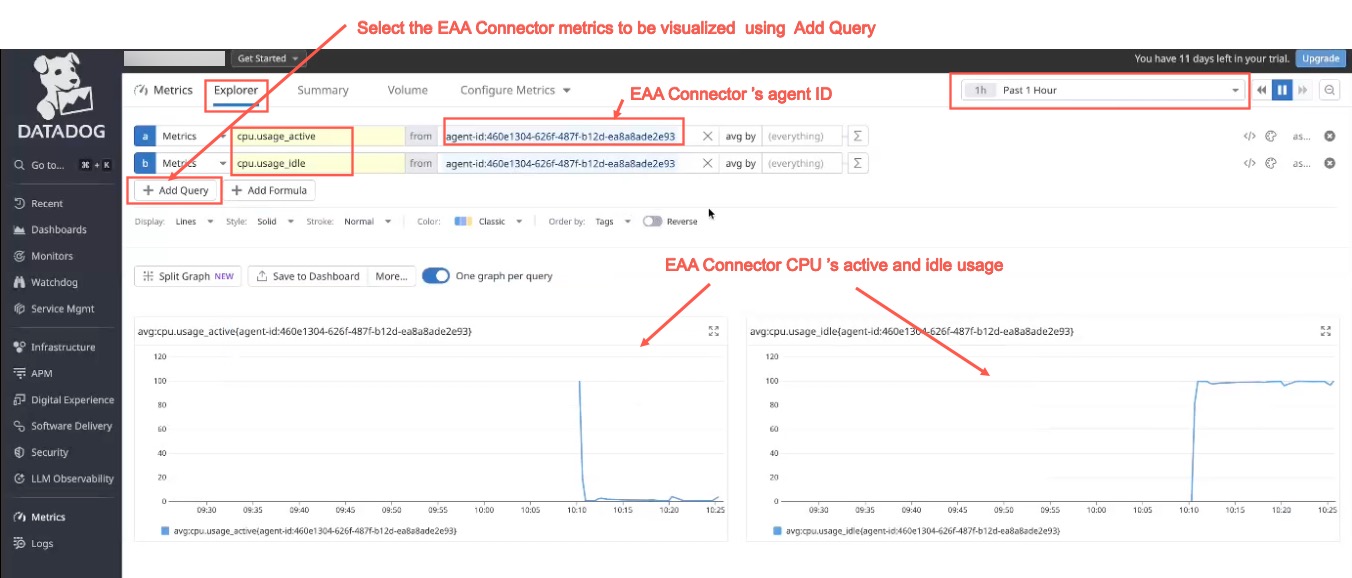
In Datadog Metrics Explorer, follow these steps for data visualization:
- Use the Add Query, to add the name of the Metrics you want to visualize in a graph.
- For the from option, add the agent-id: of the EAA connector. You can obtain this information from Akamai support.
- Select the time period.
A graph is generated for the chosen metrics.
Here’s an example of the EAA Connector’s CPU usage metrics in Datadog Metrics Explorer:
For more details on data visualization, see Datadog documentation.
Import widgets into Datadog Dashboard
You can import a JSON file from EAA and have pre-configured widgets in your Datadog dashboard instead of configuring the widgets from scratch. This saves time and improves the administrator’s productivity.
Follow these steps for importing preconfigured widgets:
- Click the link: https://techdocs.akamai.com/eaa/downloads/SIEM.json.zip to download the zip file to your downloads folder.
- Double click the zip file to extract
SIEM.jsonfile. - Log into your Datadog account.
- Go to your Dashboards page.
- Click + New Dashboard on the top right corner.
- In Create a Dashboard dialog box, click New Dashboard.
- Click Configure (gear icon), scroll down the list, and select Import dashboard JSON…
- Drag or drop the
SIEM.jsonfile you downloaded on your laptop. - For Paste dashboard JSON? , select Yes, Replace.
- Your preconfigured dashboard, Connector Metrics Dashboard with the different widgets opens.
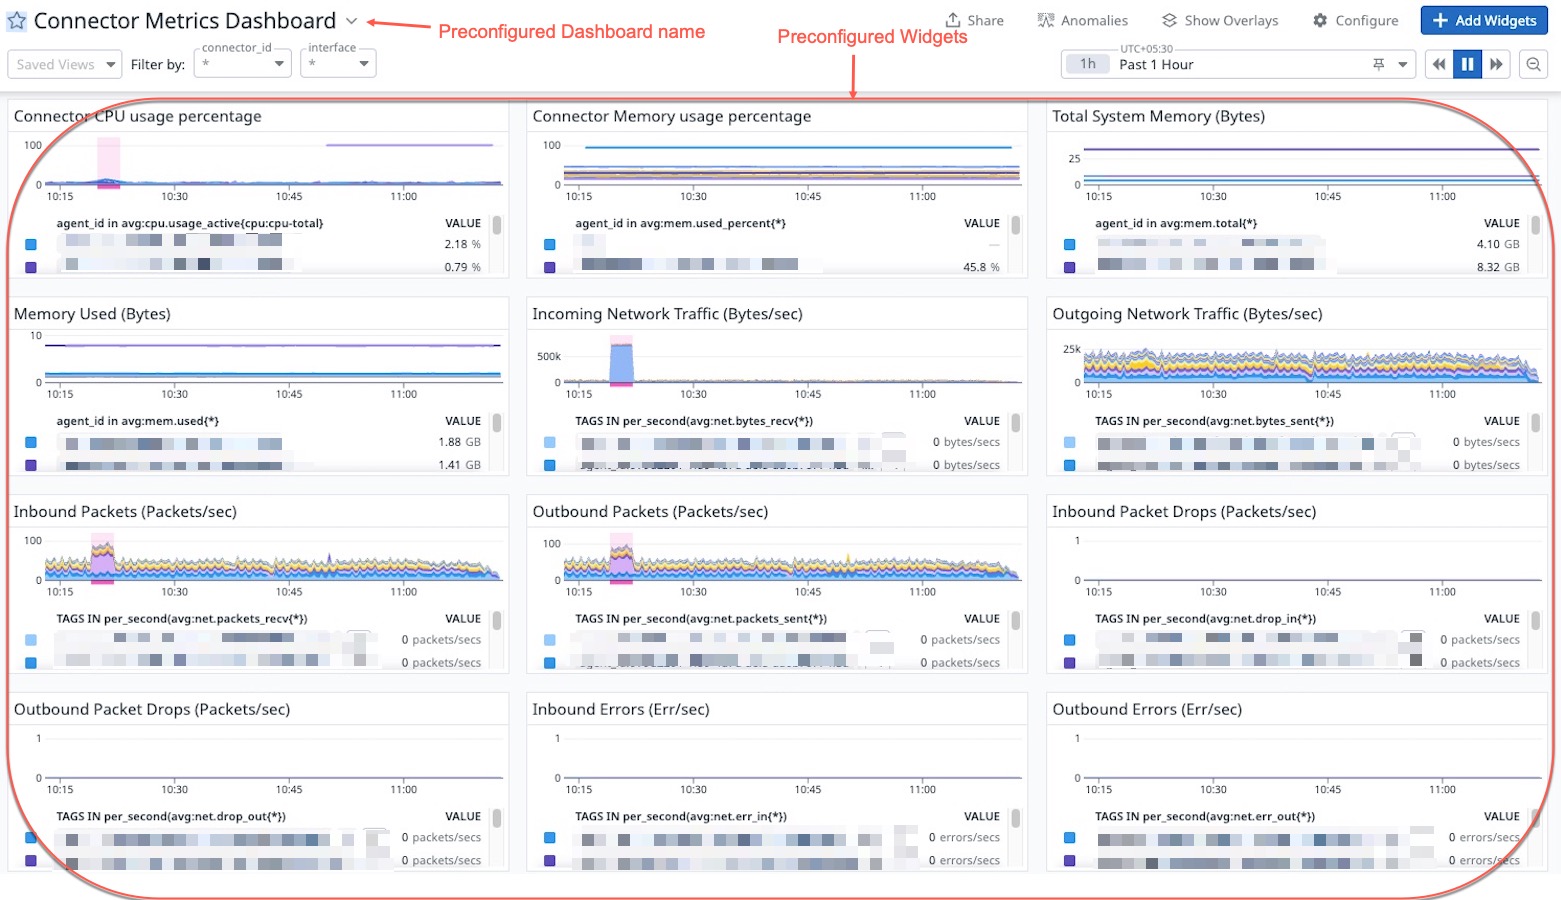
- You can use this as a starting point for your data visualization, and customize dashboard name, widgets, based on your needs.
View metrics in TrafficPeak
You can visualize EAA connector metrics as follows:
- Go to https://dashboards.trafficpeak.live/
- Log into your Grafana account.
- Click the + sign at the top-right corner and select New Dashboard.
- Click + Add visualization button.
- For Select data source, select grafana-clickhouse-datasource
- For Editor Type, select SQL Editor.
- For Query Type, select Time Series.
- You can add custom variables for the
table,time, andsqlin the Settings of your dashboard:
table:
SELECT concat(project,'.',name) as table FROM (SELECT database as project, name FROM system.tables WHERE engine = 'TurbineStorage' AND (project != 'sample_project' AND project != 'hdx'))
time:
SELECT primary_key FROM system.tables WHERE database = splitByChar('.','${table}')[1] AND table = splitByChar('.','${table}')[2]
sql:
SELECT name FROM system.columns WHERE database = splitByChar('.','${table}')[1] AND table = splitByChar('.','${table}')[2] LIMIT 1
You can reuse these variables in your queries.
- Set the table name, duration, and refresh period of your dashboard:

- In your panel editor, time series is selected as the default visualization style.
You can add different panels to your dashboard. Provide a Title, optional Description under Panel Options, and click Save Dashboard.
For example, here you can see a time series graph for net bytes received:
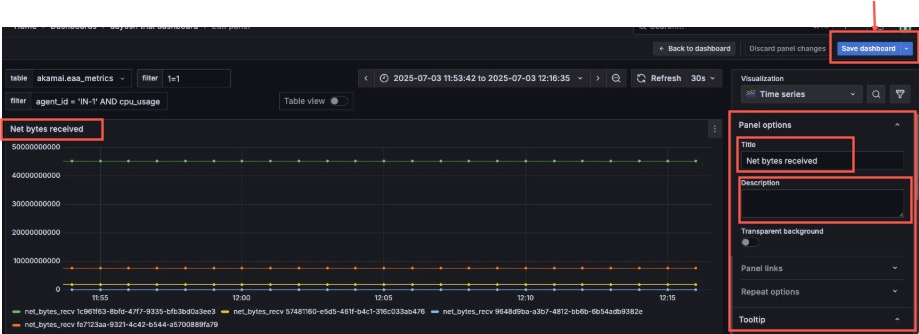
For more information, refer to Building Dashboards, Time Series Visualization sections of Grafana documentation.
Switching between SIEM provider
You can switch between different SIEM providers like DataDog and TrafficPeak.
Follow this procedure to switch SIEM providers:
- Log in to the Enterprise Center.
- In the Enterprise Center navigation menu, select Application Access > General Settings > Settings > Company Settings.
- Go to the System monitoring SIEMs section.
- You should have enabled Send metrics.
- Active SIEM. Select the SIEM that you wish to change like DataDog or TrafficPeak.
For the dialog box, SIEM switch confirmation, click Confirm. - Provide the respective parameters to connector to the SIEM server as described in Send Metrics to SIEM server.
- This SIEM provider is switched to the new one and data is streamed to it for visualization.