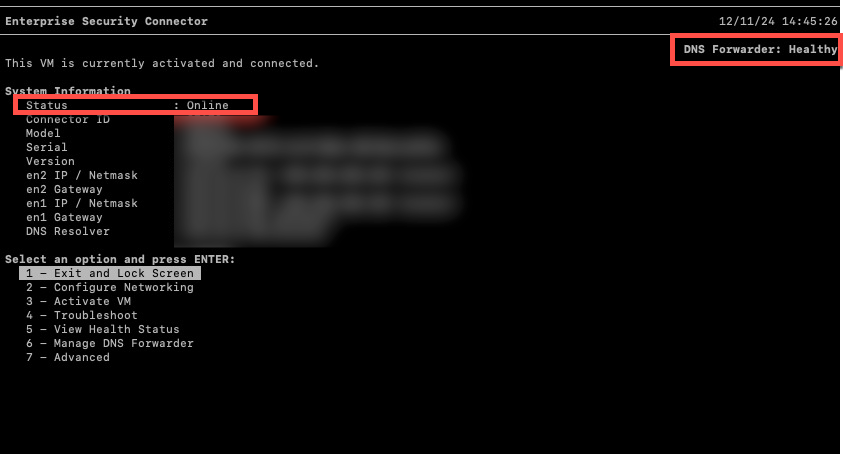
Security Connector status
As you configure and use the security connector, the status of the connector appears as part of the System Information that's shown when accessing menus in the console.
The System Information area shows the status of Security Connector as well as the state of the Security Connector type you configured.

- If Security Connector is offline, you can view more information about the health status and determine where the error is occurring. For more information, see Troubleshoot health status failures.
- If DNS Forwarder is in an unhealthy state, you can review its overall health and identify where a failure occurs. For more information about DNS Forwarder health, see Resolve DNS Forwarder status failures and View DNS Forwarder health status.
- If HTTP Forwarder is in an unhealthy state, see Troubleshoot HTTP Forwarder.
- If the sinkhole is in an unhealthy state, run a health status check. For more information, see Troubleshoot health status failures.
Run a diagnostic tool
In the Security Connector console, you can run a diagnostic tool such as dig, kdig, curl, or ping to confirm that Security Connector can retrieve information and communicate as expected. You can do the following:
- Use the dig or kdig utility to confirm that Security Connector can resolve domains.
- Use the cURL command to check that Security Connector can reach a specific URL.
- Use the ping utility to check that Security Connector can reach a specific hostname or IP address.
To run a diagnostic tool:
- In the Security Connector main menu, press 4 or use the arrow keys to select Troubleshoot and press Enter.
- Press 2 or use the arrow keys to select Run Diagnostic Tools and press Enter.
- To run dig or the kdig utility, do one of the following:
- Enter
dig <domain> - Enter
kdig <domain>
where<domain>is the domain you want to resolve.
Data on the domain appears.
- Enter
- To run cURL, enter
curl <URL>, where<URL>is the URL you want to confirm that Security Connector can reach.
Data on the URL appears. - To run ping, enter
ping <hostname>orping <IPaddress>
where:<hostname>is the hostname that you want to confirm Security Connector can reach.<IPaddress>is the IP address that you want to confirm Security Connector can reach.
Data on the hostname or IP address appears.
View debug information
You can view the hostnames and IP addresses of Security Connector services. This may be useful if you need to debug an issue with Security Connector. For example, this information is useful when running a ping test.
To view debug information:
- In the Security Connector main menu, press 4 or use the arrow keys to select Troubleshoot and press Enter.
- Press 3 or use the arrow keys to select View debug information.
- Take note of the hostnames and IP addresses that are used for these services:
- Security Connector Management Gateway
- SIA CAS Service
- SIA CSI Service
- SIA DoT Domain
- Local Web Console
Security Connector status details in SIA
The overall health and status of the Security Connector connector is reported in SIA when you view the connectors on the Security Connector page. An administrator can select to view the status details to see more information about a connector’s health and connection.
These details include:
- Date and time the status was reported. Time is reported with a 24-hour clock format.
- CPU load of VM
- Disk usage of VM
- DNS Sinkhole status to indicate whether the sinkhole is reachable or not
- DNS Forwarder status to indicate whether the forwarder is enabled or not
- DNS Forwarder port
- For a transparent or explicit proxy, this includes the number of requests that are directed to the proxy, the number of requests that are bypassed, the number of requests that are internal, and the number of requests that were not successful.
- Total number of reported errors
- Total number of received queries
- Total number of queries that are resolved with DoT
These status details are available in SIA with Security Connector 2.7.0 and later.
Updated 2 months ago
