EdgeWorkers Code Profiler
The EdgeWorkers Code Profiler helps you gain insight about the CPU performance and memory usage consumed by your EdgeWorkers code. You can view the profiling information in a V8 compatible profiling tool to see which section of your code is consuming the most CPU timing resources and the most memory resources.
For more information about how to use the profiling information to improve your code, read the Code profiler tutorial.
Watch this video to help you get started and to learn more about how to identify potential performance issues associated with EdgeWorkers execution.
Prerequisites
Before you can use the EdgeWorkers Code Profiler you need to:
-
Go to Akamai CLI for EdgeWorkers and use the instructions to install the EdgeWorkers package. You'll also find an overview of commands you can use to manage your EdgeWorkers.
Make sure to follow the instructions in the Get Started with APIs documentation. These instructions apply to both Akamai APIs and Akamai CLIs.
-
Set up authentication for your CLI requests using EdgeGrid, a proprietary authentication system for APIs deployed through Akamai Control Center.
-
To use the VS Code extension to profile your code, install the Akamai EdgeWorkers Toolkit for VS Code.
-
To use the IntelliJ plugin to profile your code, install the Akamai EdgeWorkers IntelliJ Plugin.
Use the VS Code extension or the IntelliJ plugin to profile your code
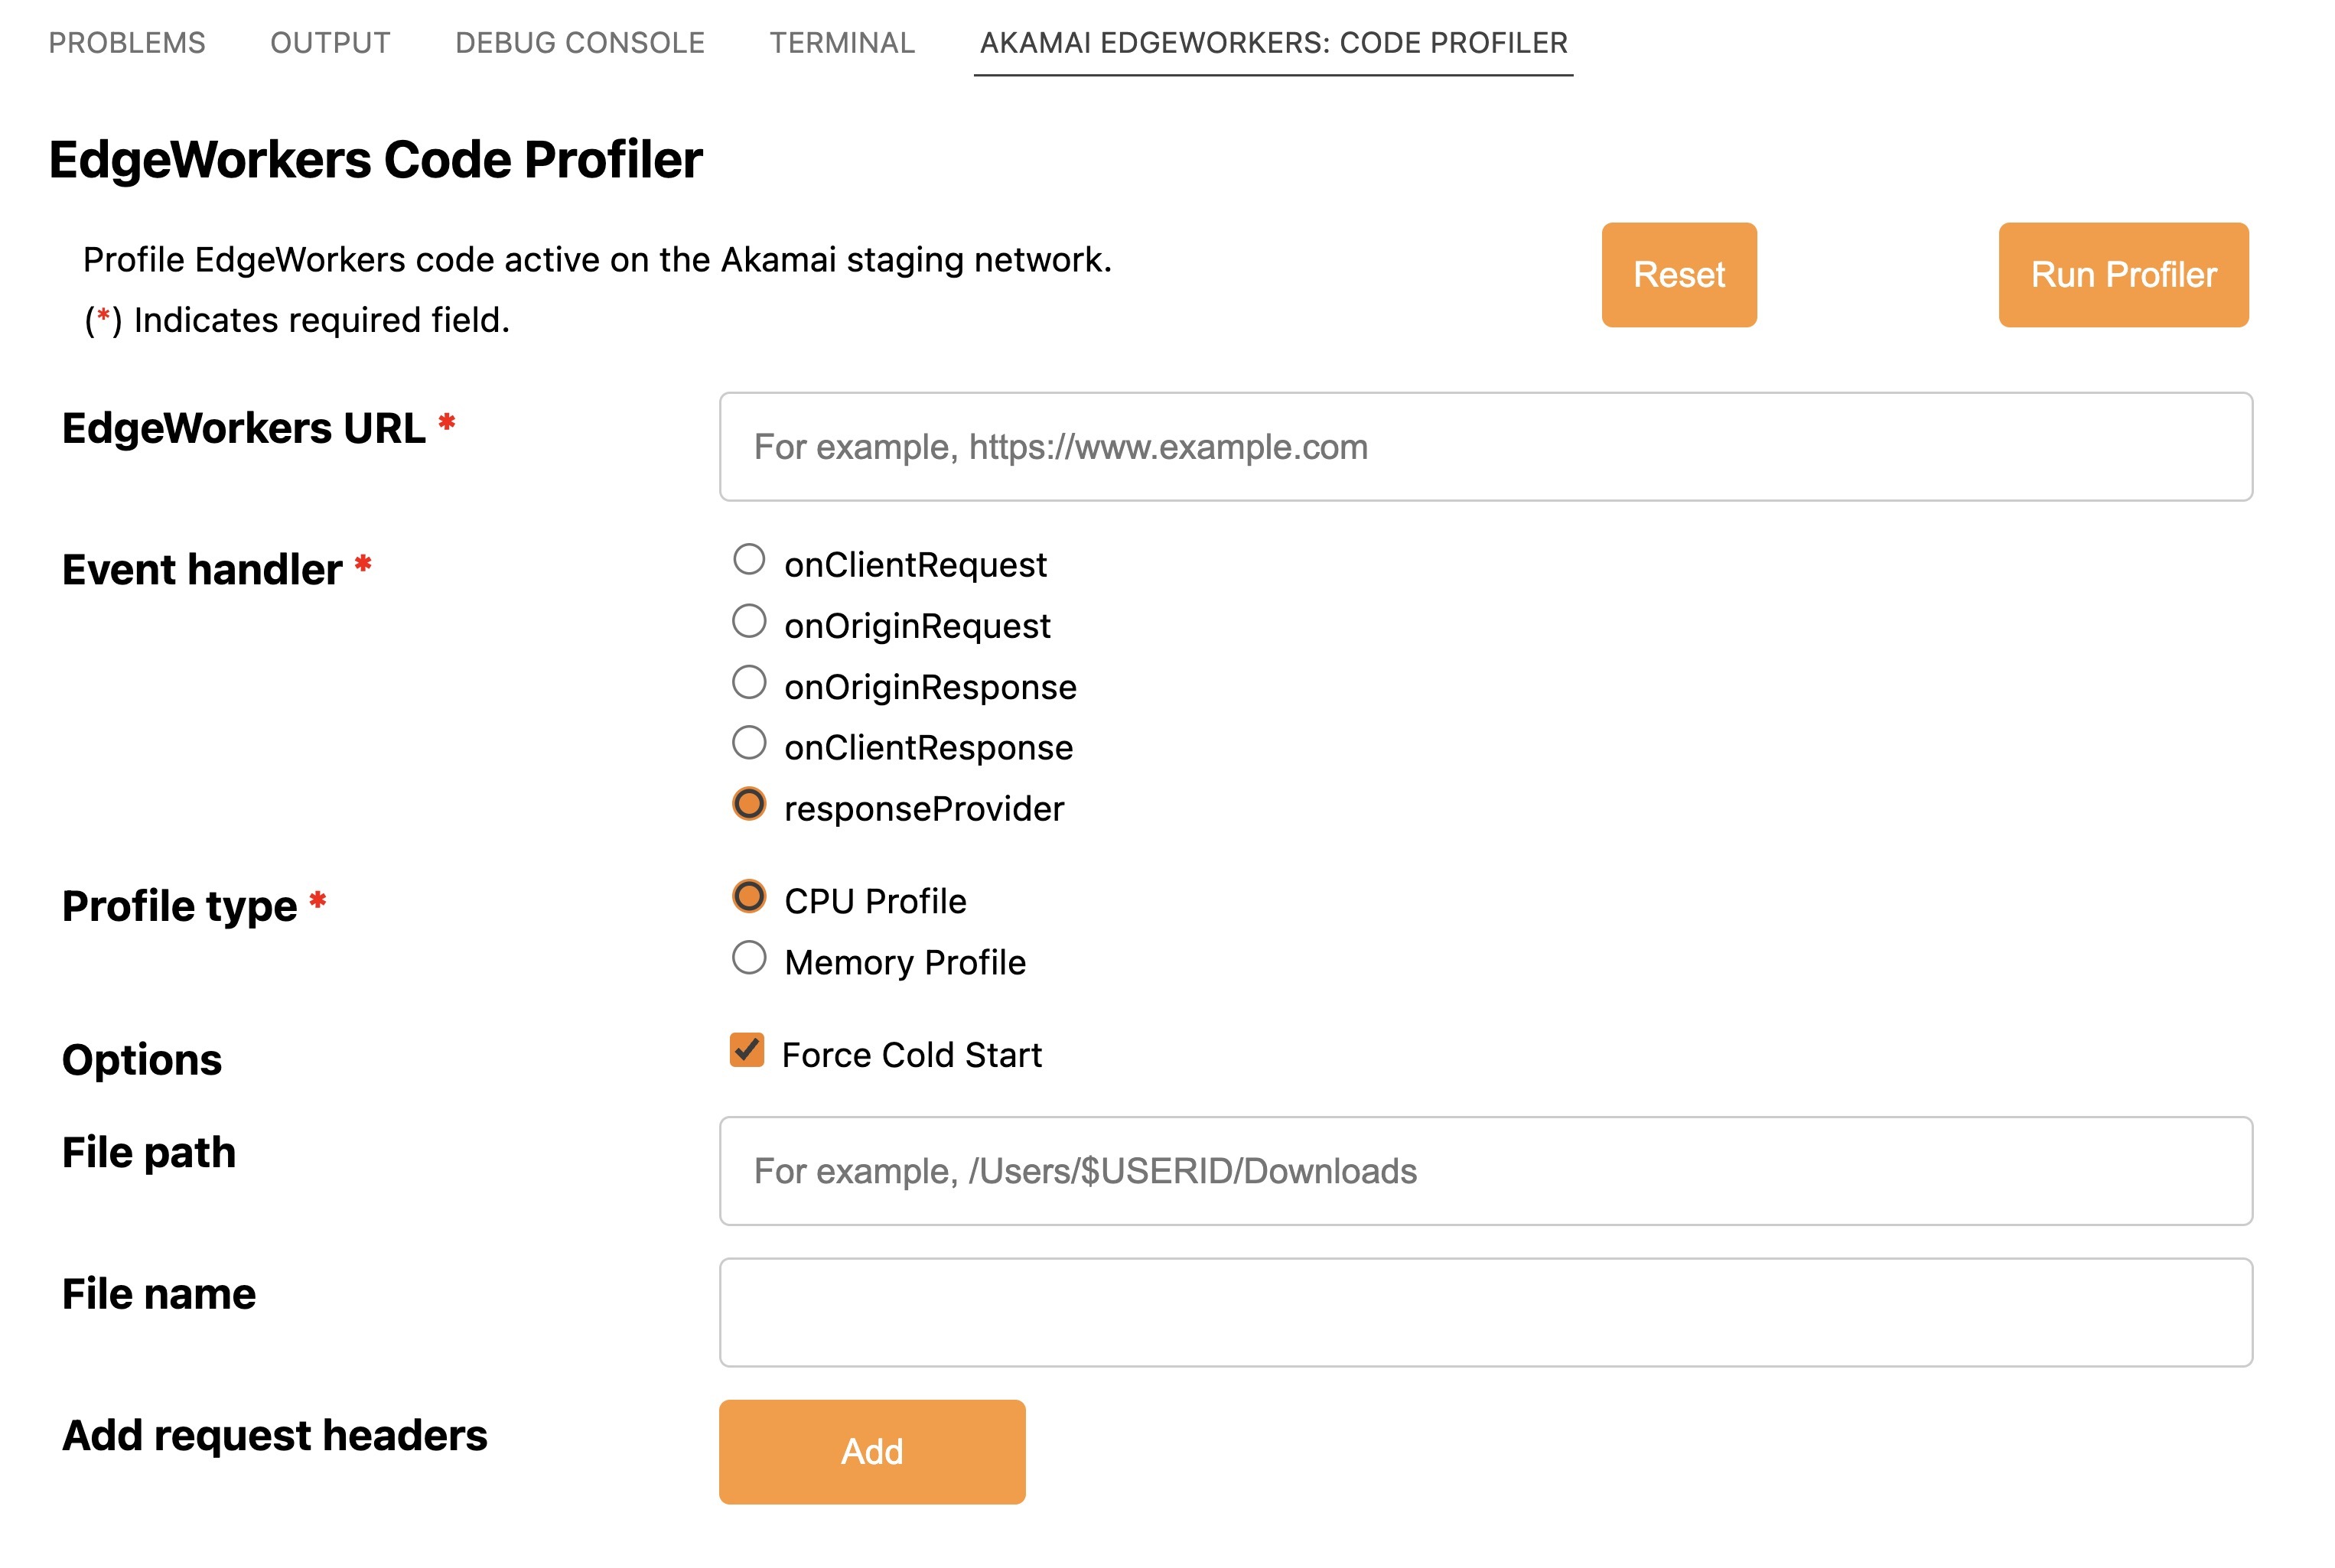
Once you've completed the prerequisites, the EdgeWorkers Code Profiler will appear in the bottom panel of the EdgeWorkers VS Code extension or IntelliJ plugin.
Profiling is currently limited to the Akamai staging network.
- To profile your code, enter the URL where your EdgeWorkers function is configured to execute.
Here's an example of the Code Profiler in the EdgeWorkers VS Code extension.

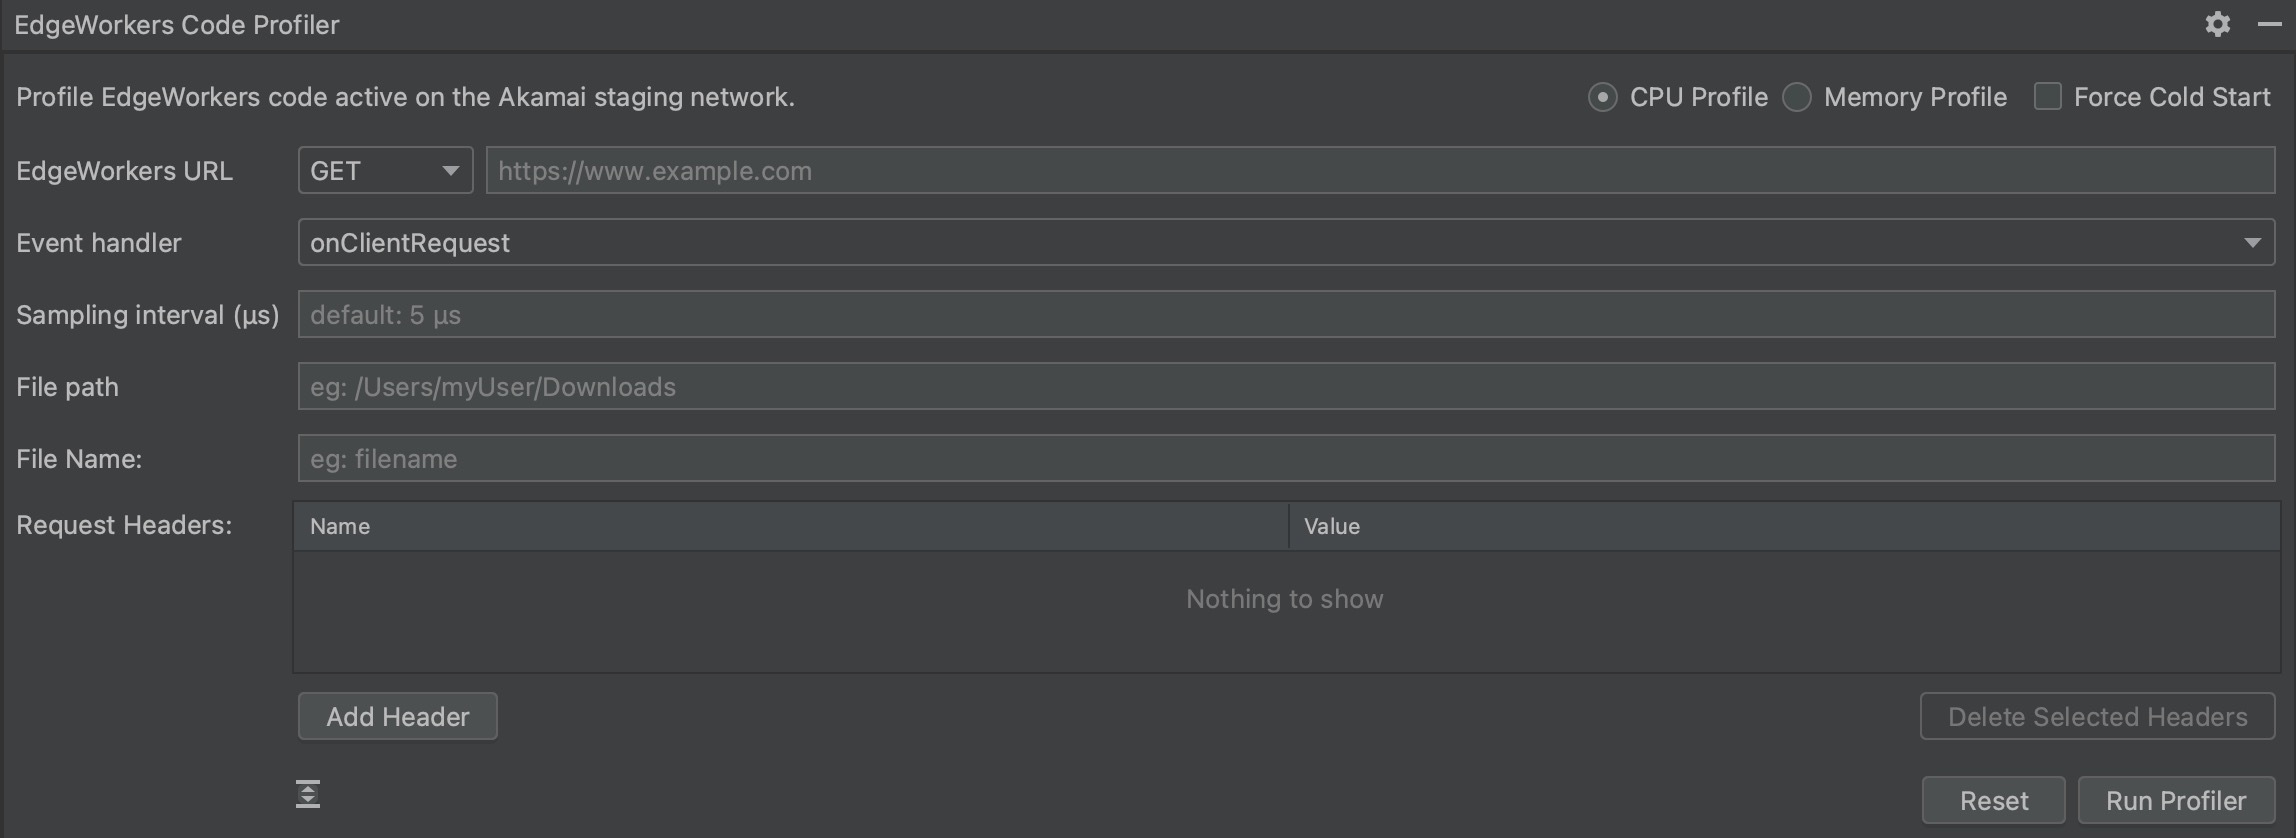
Here's an example of the Code Profiler in the EdgeWorkers IntelliJ Plugin.

-
Select a Profiling type, either CPU Profiling or Memory Profiling.
-
Select Force Cold Start if you want to run the EdgeWorkers initialization code first.
Cold start profiling results include information about code that runs outside an EdgeWorkers event handler. You can use these insights to help improve the wall time consumption of your code during EdgeWorkers events.
-
The IntelliJ plugin lets you apply the following additional parameters.
-
Select an HTTP Method supported by EdgeWorkers to use.
-
Specify the granularity of the Sampling Interval to help display faster running segments of code. Note that you can create a profile that's too big to return.
- Select an event handler to profile.
The EdgeWorkers Code Profiler operates on a per event handler basis. Event handler results are limited to one event handler per request.
- You can optionally specify a location and a name for the profiler results file.
- You can also add request headers.
- Click the Run Profiler button to get a profile of the JavaScript code.
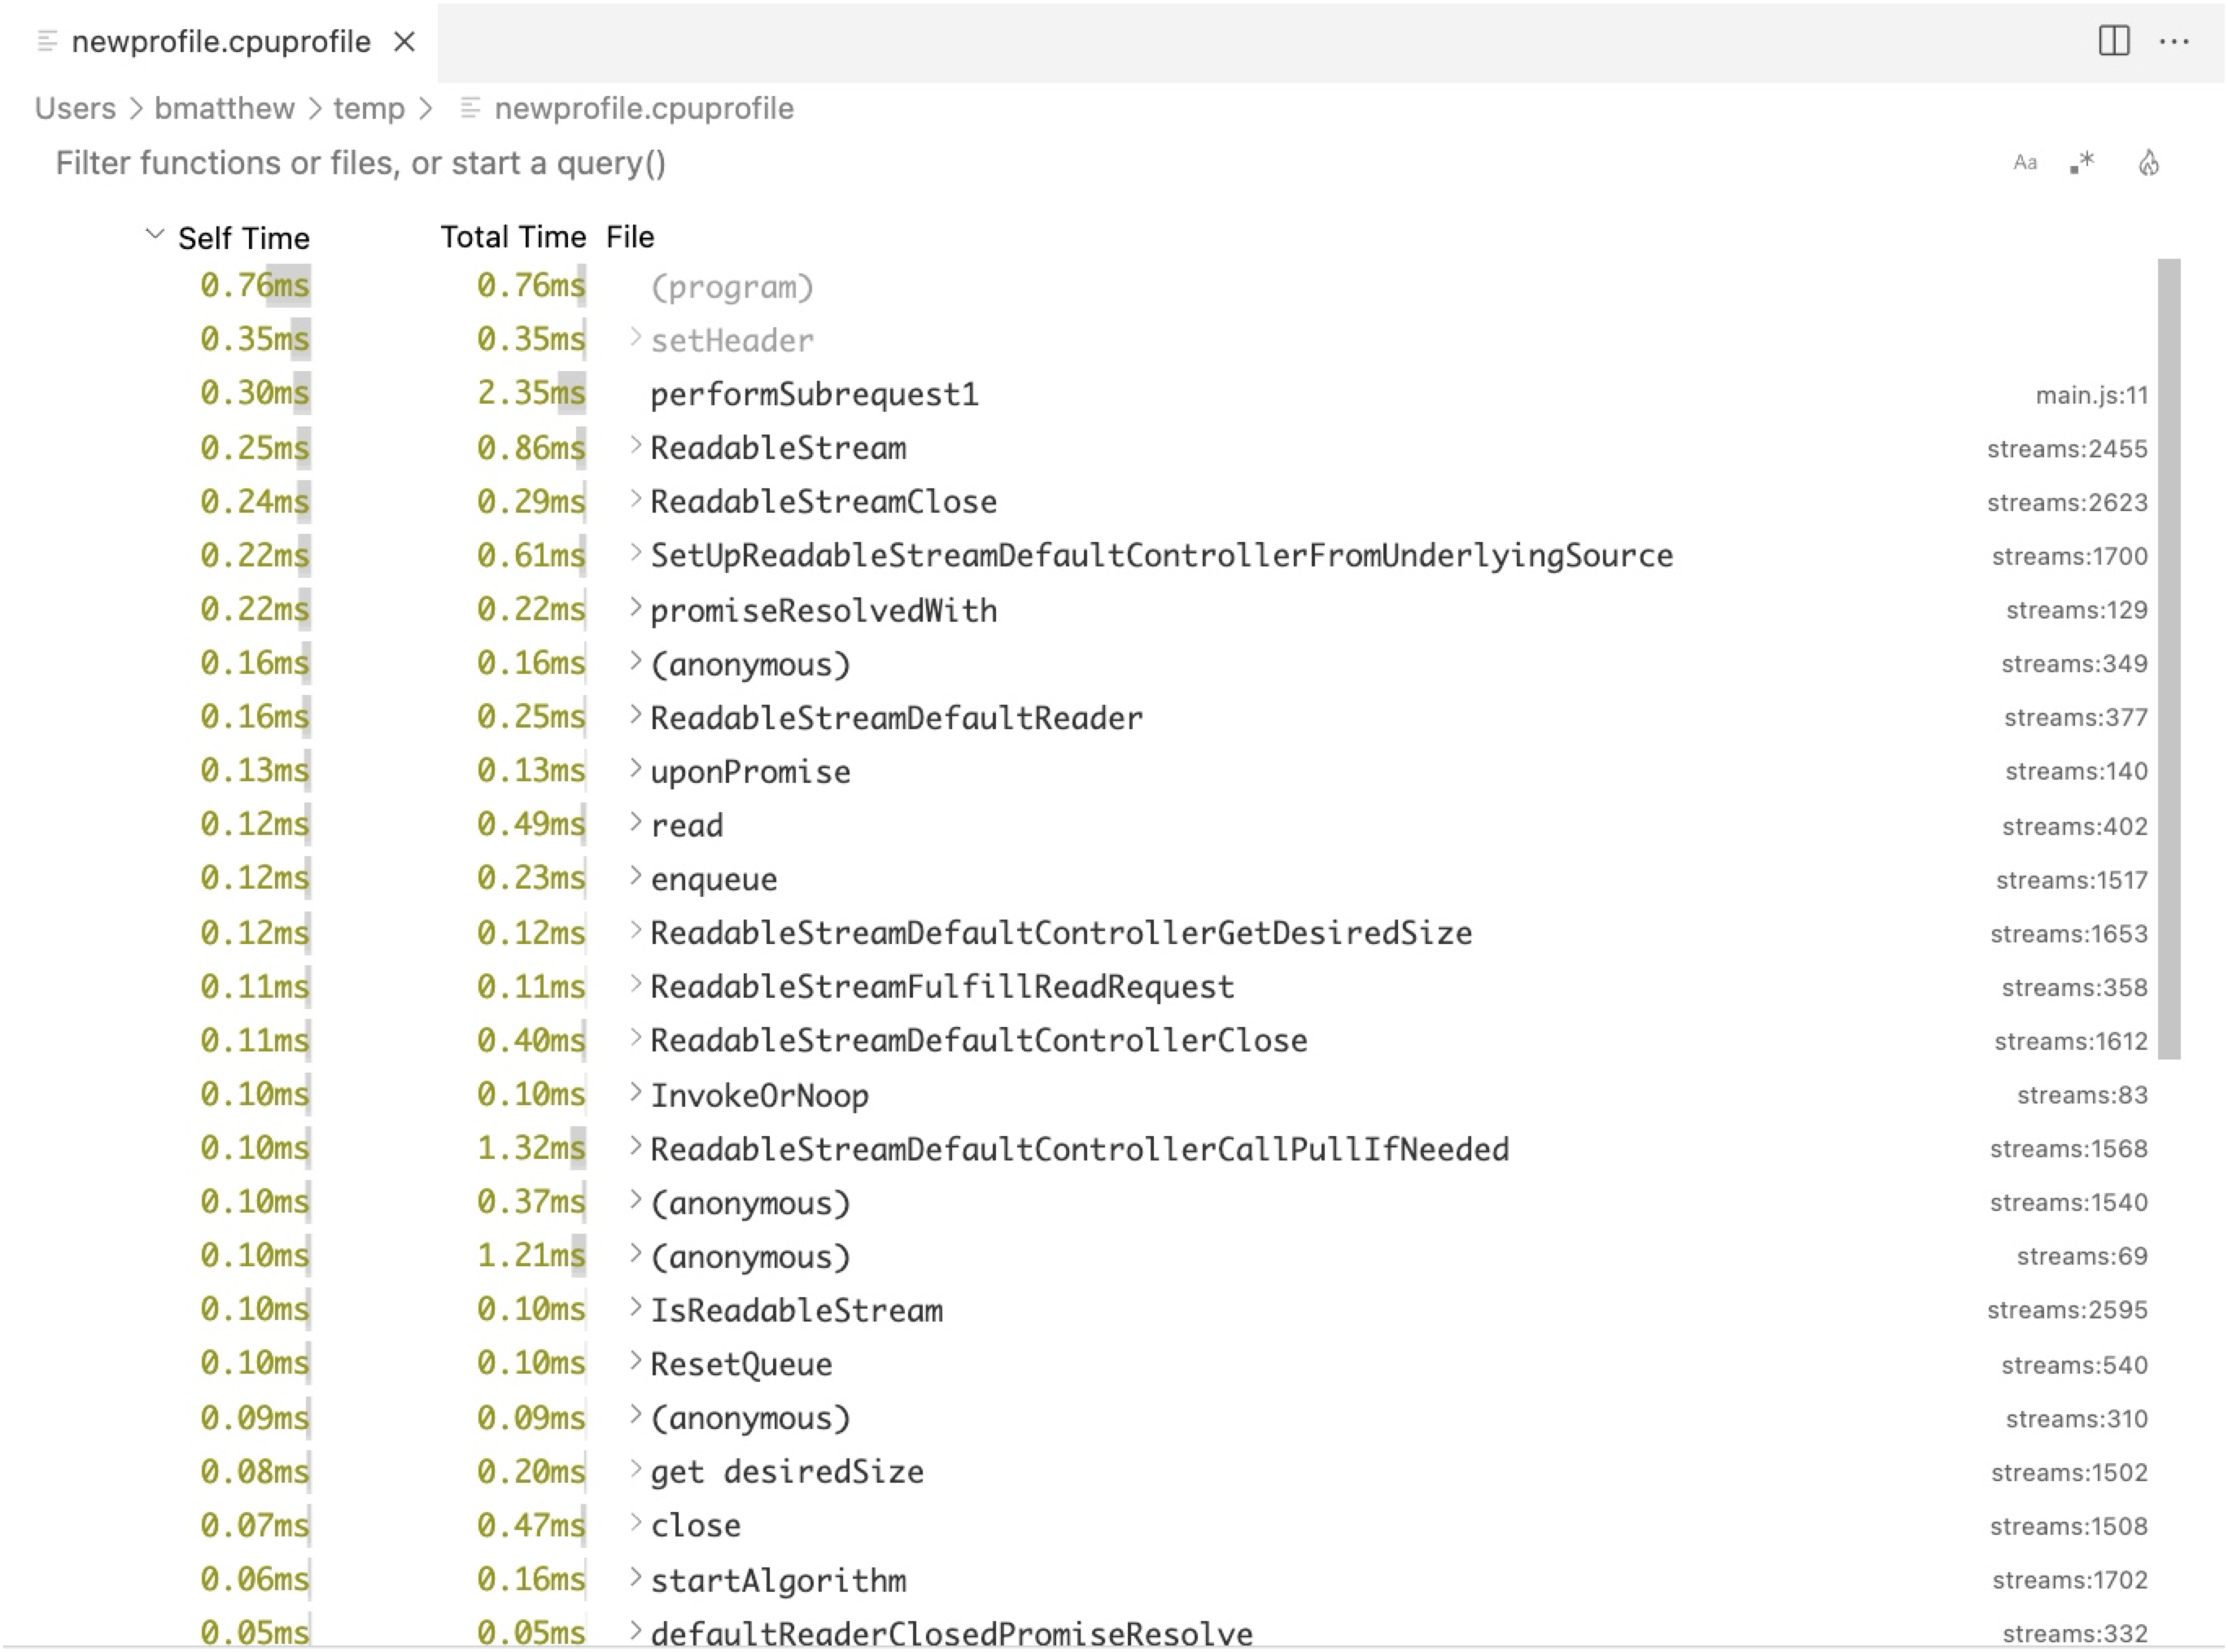
Here's an example of the profiling output in the EdgeWorkers VS Code extension.

Here's an example of the profiling output in the EdgeWorkers IntelliJ Plugin.

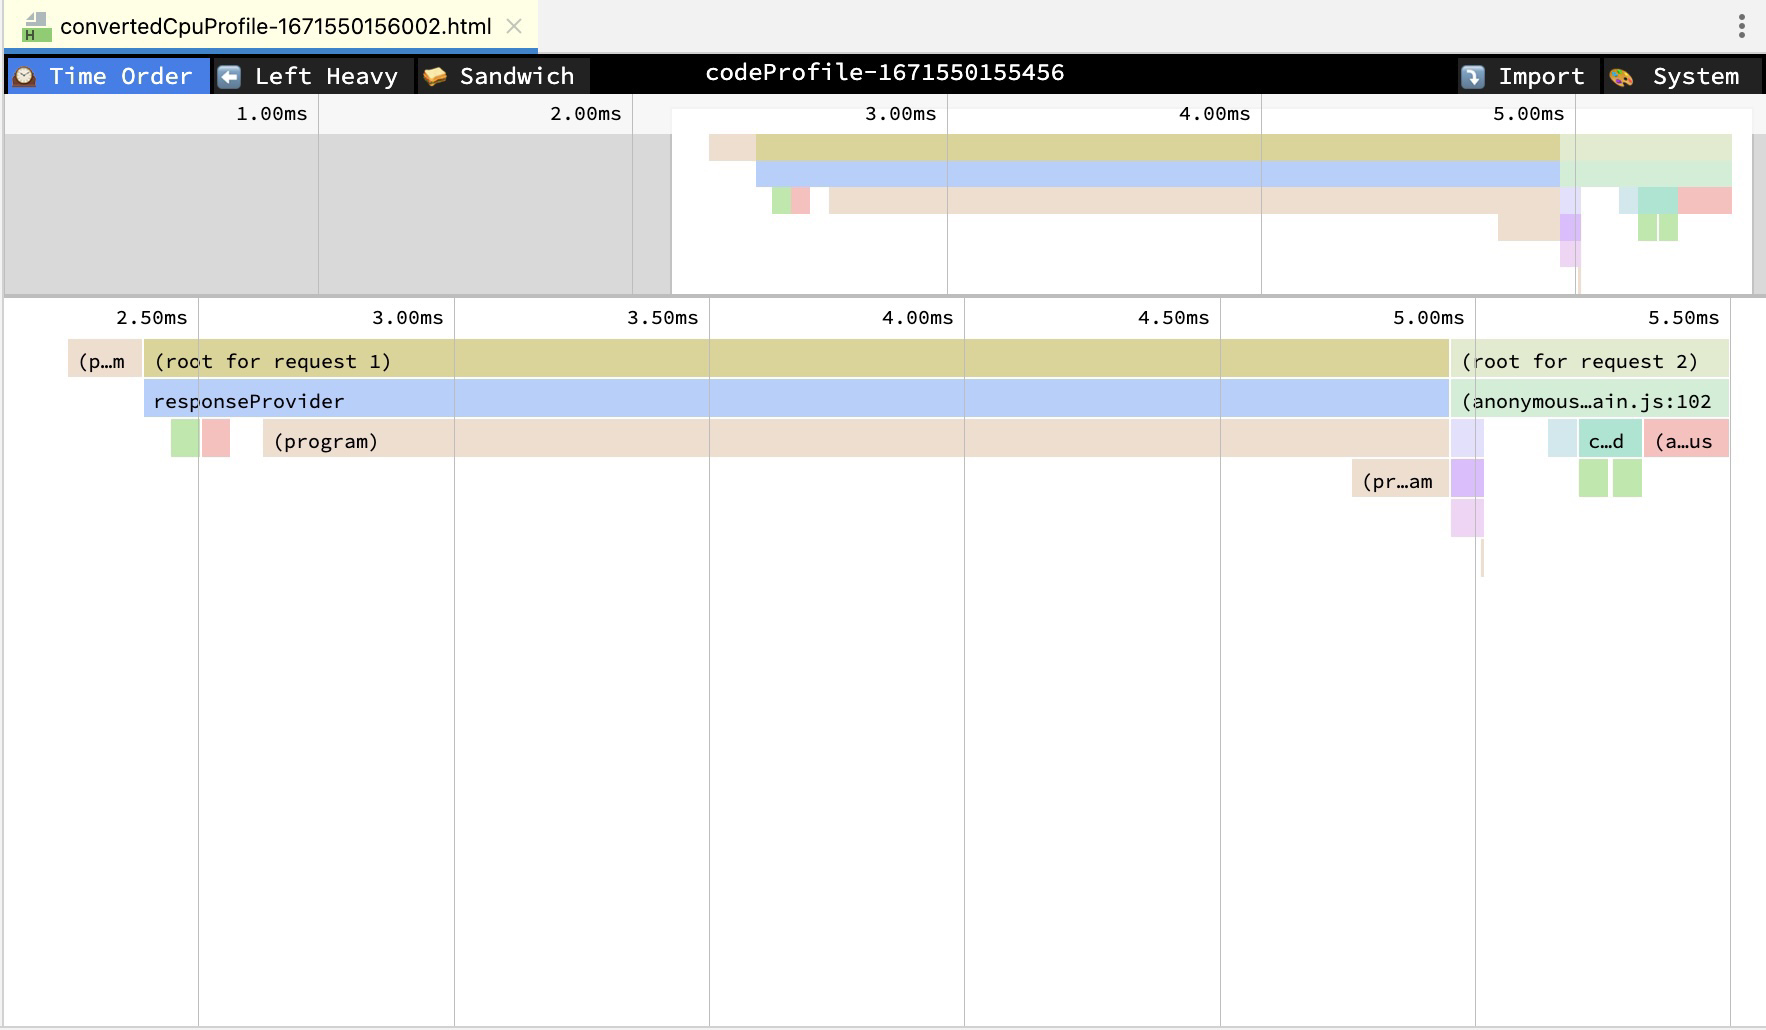
- Click on the “flame” icon in the top right corner of the profiler tool to view the EdgeWorkers execution details in a flamegraph. Flamegraphs illustrate the stack trace and the amount of time spent in each stack frame.
Here's an example of a flamegraph generated using the EdgeWorkers VS Code Extension.

Here's an example of a flamegraph generated using the EdgeWorkers IntelliJ Plugin.

Use the CLI to profile your code
If you can’t use the VS Code extension, the IntelliJ plugin, or if you need more flexibility you can use the CLI to profile your code.
Profiling is currently limited to the Akamai staging network.
Request code profiling information
Follow these steps to generate a JWT authentication token and add code profiling details to your requests. You can also use these steps to re-generate an expired token.
You can also use the EdgeWorkers API to generate a secure token.
-
Use this EdgeWorkers CLI command to generate an authentication token. In this example we set the token expiry to 60 minutes for the
www.example.comhostname.By default, the token expiry is set at 480 for 8 hours. You can set the token expiry to a value between 1 to 720 minutes.
akamai edgeworkers auth --expiry 60 www.example.comYou need to provide the EdgeWorkers CLI with API access to the hostname in the request. Without this access the command will fail to provide valid code profiling information. For more information refer to the Get Started with APIs documentation.
- Here’s an example of a response.
Creating auth token ... /
------------------------------------------------------------------------------------------------------------------------------------------------
Add the following request header to your requests to get additional trace information.
Akamai-EW-Trace: eyJ0eXAiOiJKV1Qi ... iu1XOS9eJOl-54Yw
-------------------------------------------------------------------------------------------------------------------------------------------------
Active your EdgeWorkers code bundle.
-
Choose an event handler to profile:
x-ew-code-profile-onclientrequest: onx-ew-code-profile-onoriginrequest: onx-ew-code-profile-onoriginresponse: onx-ew-code-profile-onclientresponse: onx-ew-code-profile-responseprovider: on
If multiple headers are included in the request, the one that executes first is used. For example, if
onClientRequestandonOriginResponseare included in the request onlyonClientRequestis included in the profiling request. -
Select a Profile type, either CPU Profile or Memory Profile.
x-ew-code-profile-memory: onx-ew-code-profile-cpu: on
-
To profile your code during a cold start include the
x-ew-code-profile-during-cold-start:onheader in the request.A cold start profiling request runs the EdgeWorkers initialization code first. The results include information about code that runs outside an EdgeWorkers event handler. You can use these insights to help improve the wall time consumption of your code during EdgeWorkers events.
-
Issue an HTTP request with the JWT token and an event handler.
'https://www.example.com/' --resolve www.example.com:443:23.193.6.69 -H 'akamai-ew-trace: eyJ0eXAiOiJKV1Qi ... iu1XOS9eJOl-54Yw'-H 'x-ew-code-profile-onclientresponse: on' > newprofile.cpuprofile- The JSON profile data is returned as the HTTP response body.
{"nodes":[{"id":1,"callFrame":{"functionName":"(root)","scriptId":"0","url":"","lineNumber":-1,"columnNumber":-1},"hitCount":0,"children":[2,3]},{"id":2,"callFrame":{"functionName":"(program)","scriptId":"0","url":"","lineNumber":-1,"columnNumber":-1},"hitCount":5},{"id":3,"callFrame":{"functionName":"onClientRequest","scriptId":"3","url":"main.js","lineNumber":5,"columnNumber":31},"hitCount":1,"children":[4,5,6,7],"positionTicks":[{"line":25,"ticks":1}]},{"id":4,"callFrame":{"functionName":"Cookies","scriptId":"4","url":"cookies","lineNumber":43,"columnNumber":20},"hitCount":1,"positionTicks":[{"line":46,"ticks":1}]},{"id":5,"callFrame":{"functionName":"checkLanguage","scriptId":"3","url":"main.js","lineNumber":45,"columnNumber":22},"hitCount":1,"positionTicks":[{"line":54,"ticks":1}]},{"id":6,"callFrame":{"functionName":"checkRedirect","scriptId":"3","url":"main.js","lineNumber":68,"columnNumber":22},"hitCount":2,"positionTicks":[{"line":86,"ticks":1},{"line":72,"ticks":1}]},{"id":7,"callFrame":{"functionName":"SetCookie","scriptId":"4","url":"cookies","lineNumber":265,"columnNumber":22},"hitCount":1,"positionTicks":[{"line":280,"ticks":1}]}],"startTime":6399655041506,"endTime":6399655043547,"samples":[2,2,2,4,5,6,6,7,3,2,2,2],"timeDeltas":[1373,89,54,65,57,5,62,70,50,58,18,59]}9. You can import the response into a compatible JavaScript profiling tool. For example, you can view the profiling details in the Performance section of the Chrome DevTools.
FAQ
Review these commonly-asked questions about the EdgeWorkers Code Profiler.
How do I use the EdgeWorkers Code Profiler?
The easiest way to use the EdgeWorkers Code Profiler is to install the VS Code Extension or the Intellij Plugin . When you set up this Visual Studio Code extension, you also need to set up the EdgeWorkers CLI and create an .edgerc file with Akamai API Client credentials.
What profiling capabilities are available?
This release of the EdgeWorkers Code Profiler supports CPU and memory profiling. The next release will cover additional functionality.
Can I profile code on the Akamai staging and production networks?
Profiling is only supported on the Akamai staging network.
Can I load the profiling data in Chrome DevTools?
Yes. We recommend that you use the Chrome DevTools to help analyze your profiling data.
Can I use Sandbox to run the EdgeWorkers Code Profiler?
Yes. You can use Akamai Sandbox to run the code profiler through a sandbox URL.
Which IDEs support the EdgeWorkers Code Profiler?
Currently the EdgeWorkers Code Profiler supports the VS Code and IntelliJ extensions.
Why do some very short running functions not appear in the output CPU profile?
The EdgeWorkers Code Profiler leverages the V8 profiler that takes samples from a given interval. Because of this, some functions may not appear in the profile results. A future release will include the ability to control the sample interval. This update will allow you to tune the sample down to see short running functions at the expense of a larger output file.
Updated about 2 months ago
