CPU time report
This report lists event handler and initialization CPU times in milliseconds, grouped by event handler. Only the selected event handlers appear in the report. For example you can create a report that displays information only when the EdgeWorkers function is executed on the onClientRequest event handler.
You can also filter the event handler and initialization CPU times of the EdgeWorker IDs selected for the report to show the results for various percentiles. Viewing percentiles can help you identify long tail and outlier use cases. You can then use this information to optimize the performance and stability of your EdgeWorkers functions.
To learn more, refer to the EdgeWorkers best practices for performance.
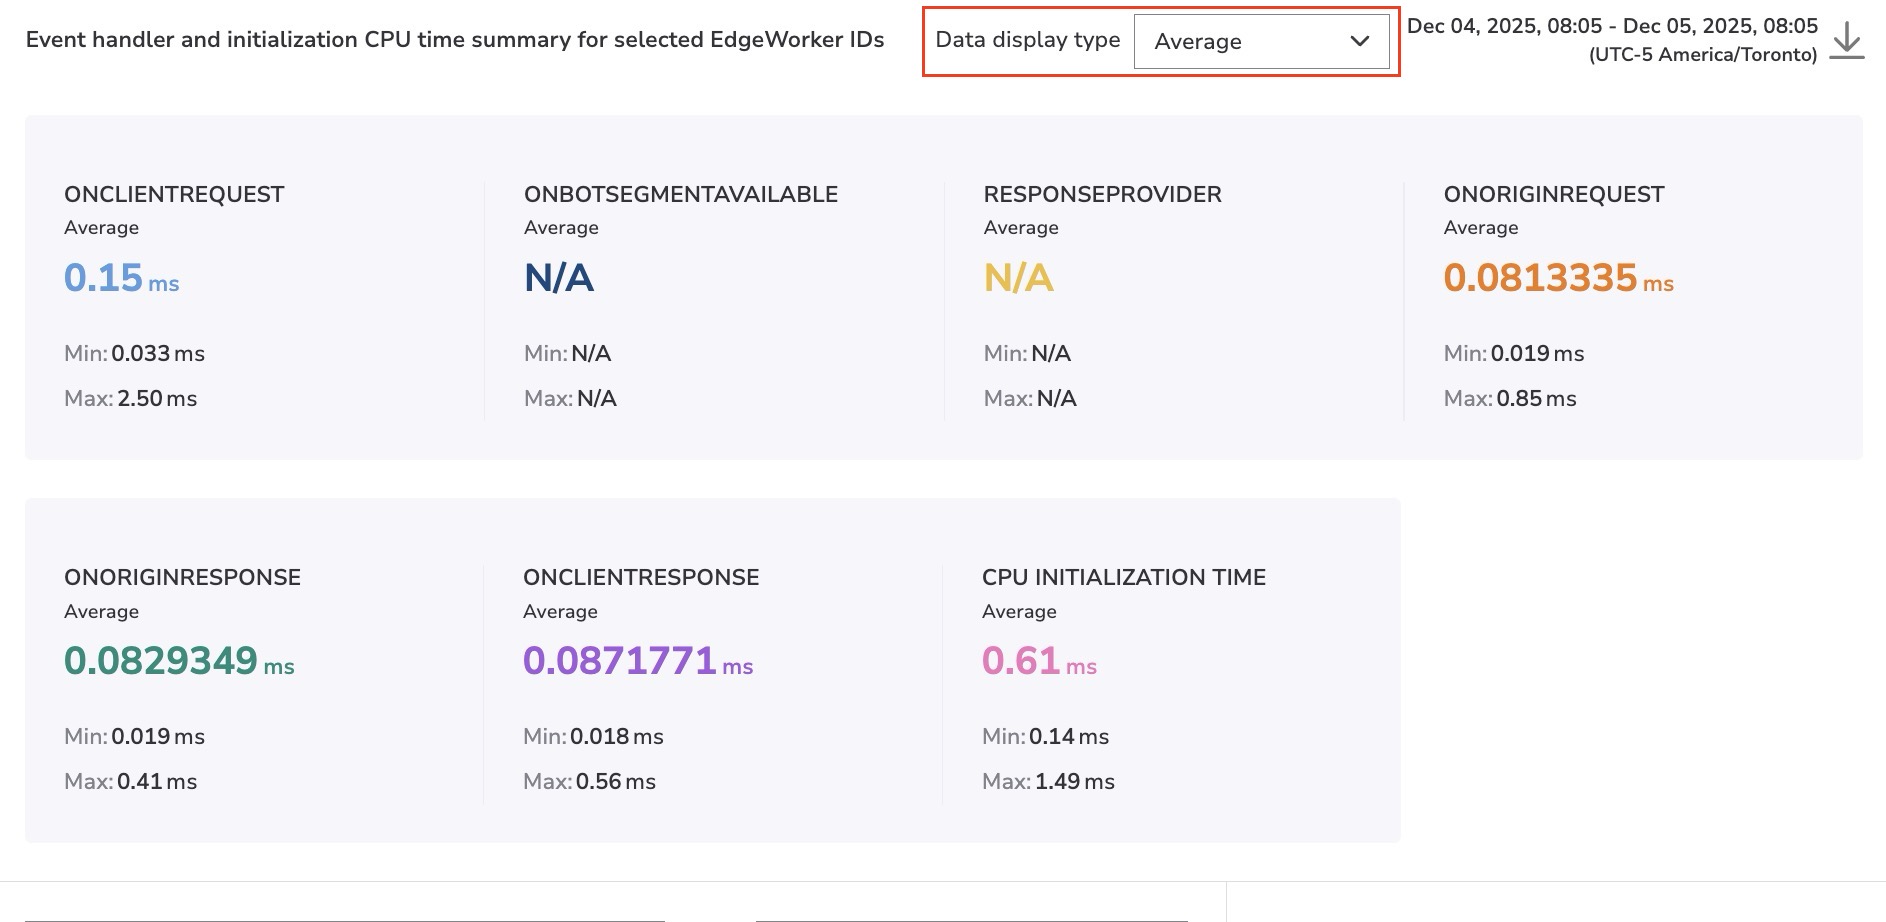
Event handler and initialization CPU time summary for selected EdgeWorker IDs
By default, the report shows the average CPU execution time for each event handler and the average CPU initialization time. The results include data for all the EdgeWorker IDs you selected for the report. The average is calculated by adding up all of the individual values included in the report and dividing this total by the number of observations.
For a more in-depth performance analysis you can display the report results by percentile. Percentiles aren't skewed by outliers and every data point is an actual measure of user experience. A percentile is a value on a scale of 100 that indicates the percent of a distribution that is equal to or below it. For example, the 95th percentile is the value which is greater than 95% of the all observed values.
- To show the results for various percentiles, select an option from the Data display type dropdown.
- Review the table below for details about each of the Data display type options.
| Select | The report displays |
|---|---|
| Average | The average CPU time used to invoke the event handler. |
| 25th percentile | The CPU time for the 25th percentile. 25 percent of the invocations took less time than the value displayed in the report. |
| 50th percentile | The CPU time for the 50th percentile. 50 percent of the executions took equal to or less time than the value displayed in the report. |
| 75th percentile | The CPU time for the 75th percentile. 75 percent of the invocations took equal to or less time than the value displayed in the report. |
| 95th percentile | The CPU time for the 95th percentile. 95 percent of the invocations took equal to or less time than the value displayed in the report. |
| 99th percentile | The CPU time for the 99th percentile. 99 percent of the invocations took equal to or less time than the value displayed in the report. |
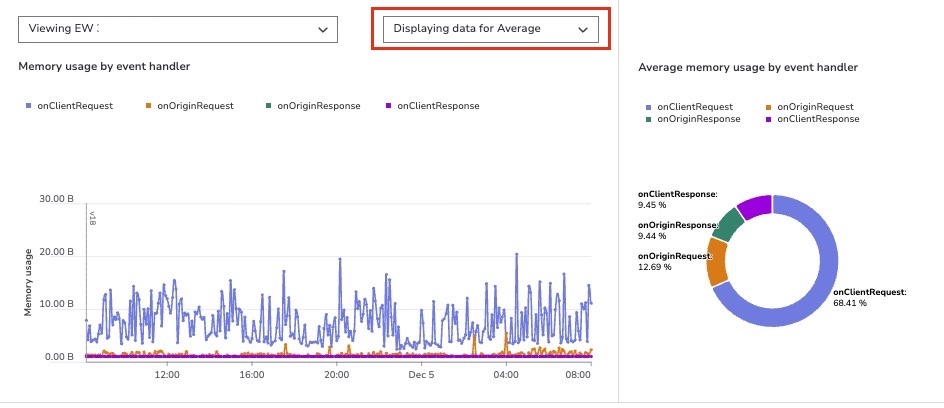
Cumulative CPU time by event handler and initialization time
This section of the report displays the cumulative event handler and initialization CPU time results for one version of an EdgeWorker ID at a time. To view the data for a specific EdgeWorker ID, select it from the dropdown.
-
You can select the Data display type for this chart as well. This lets you view the results for the selected EdgeWorker ID within the various percentiles.
-
You can also view the average CPU time for each event handler in the donut chart.
-
If the EdgeWorker version includes child EdgeWorkers, the active revision ID also appears in the graph. For more information see, Flexible composition.
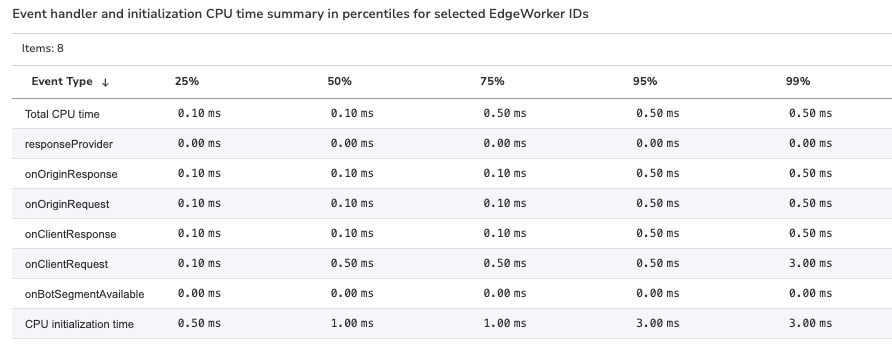
View the event handler and initialization CPU time summary in percentiles for selected EdgeWorker IDs
This report displays the CPU initialization time and CPU time by event handler and the total CPU time across percentiles. Using this view you don't have to select each Data display type option separately.
Updated 5 months ago