Reporting - Application Load Balancer
Reporting for Application Load Balancer is available from Edge Logic Cloudlets and from Reporting. This page covers reporting from Edge Logic Cloudlets.
Application Load Balancer Reporting provides the status and summaries for:
- Load Balancing Setup
- Data Center Availability
- DNS Traffic
- Liveness Testing
Generate the report
To generate an Application Load Balancer report:
-
Go to ☰ > CDN > Edge logic Cloudlets.
-
Click on Reporting and Application Load Balanc....

- Select the Network and Load Balancing Setup from the pull down lists.
The report for the selected load balancer is generated and includes the following information.
Load Balancing Setup Status
The first section in the report provides the current status of your data centers. While this section is designed to update every 5 minutes, please note that the most recently available 5-minute interval typically appears with a delay of approximately 15 minutes.
Update frequency and latency notice
While the Load Balancing Setup Status report is designed to update every 5 minutes, due to current system behavior, the most recent 5-minute interval may take approximately 15 minutes to become available.
This means that while the report reflects the latest available data, it does not provide real-time status updates.
If you require real-time insights, please consider alternative monitoring tools or reach out to our support team for recommendations.
- Data Center Id – when you hover over these ids, the hostname associated with the data center appears.
- Status – the current status of the data centers for the most recently available 5-minute interval, based on liveness testing.
- DNS Traffic (Requests/Second) – the request rate for the most recently available 5-minute interval.

Data Center Availability Summary
This section in the report provides each data centers availability over the last 10 days. The percentage of time that each data center is available and unavailable is displayed. Your data center is considered available if liveness testing determines that traffic can be sent to the data center.

DNS Traffic Summary
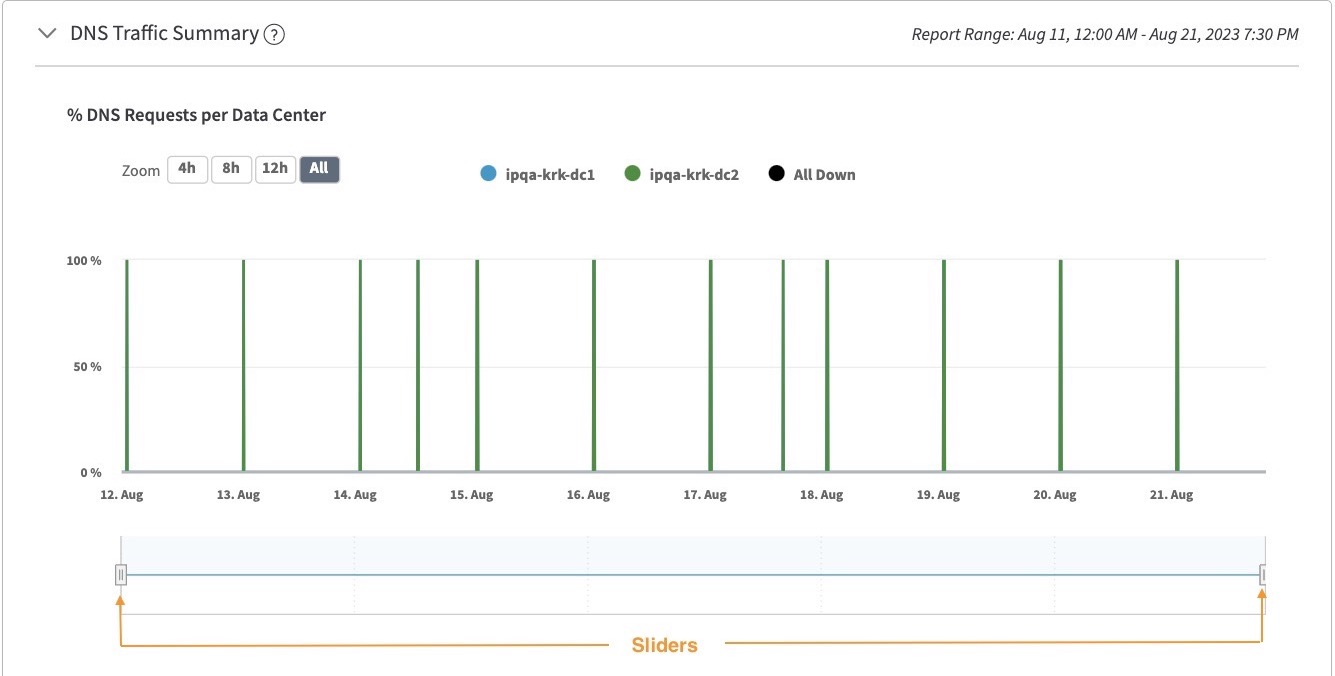
This section shows your DNS traffic over the last 10 days and is divided into three areas; percentage of traffic to each data center, DNS requests per second per data center and a summary of your DNS traffic per data center.
% DNS Requests per Data Center
A stacked chart shows the percentage of traffic going to each data center

You can zoom in to see DNS traffic data from the last 4, 8 or 12 hours or for all 10 days. Use the right and left sliders below the chart to focus on a different time period.
You can also show and hide DNS traffic data for a specific data center by clicking on the data center name at the top of the chart.
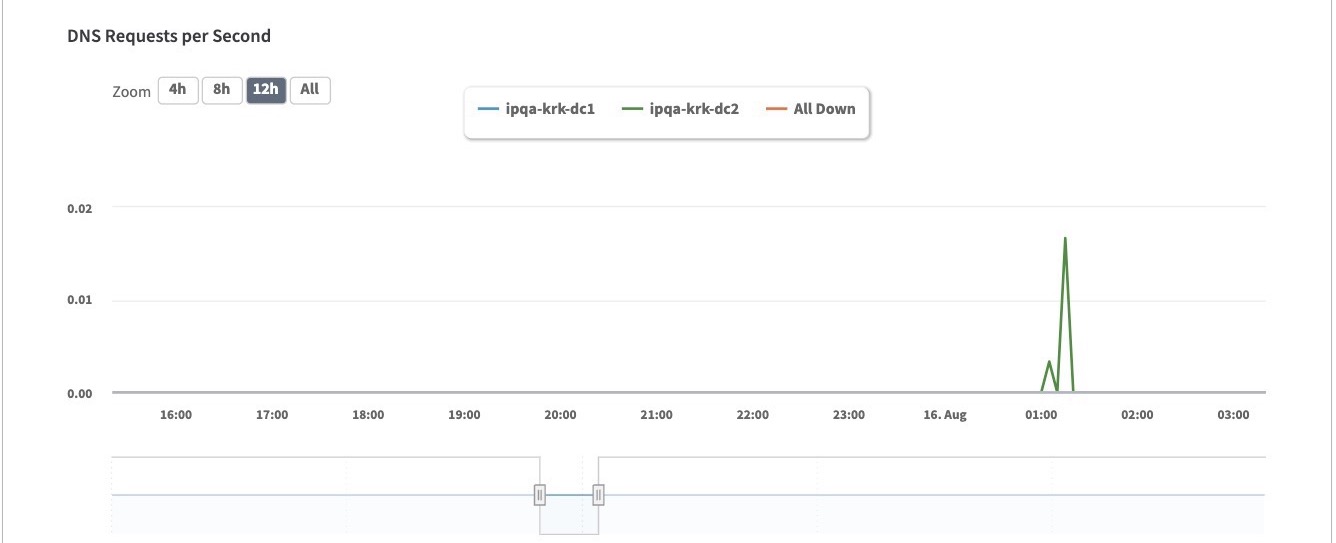
DNS Requests per Second
This line graph shows the number of DNS requests per second over the selected time period which can include requests going back to the past 10 days.

You can zoom in to see DNS traffic data from the last 4, 8 or 12 hours or for all 10 days. Use the right and left sliders below the chart to focus on a different time period.
You can also show and hide DNS traffic data for a specific data center by clicking on the data center name at the top of the chart.
Data Center DNS Summary
A table provides the key metrics for all individual data centers. Metrics include average number of requests, minimum and maximum number of requests, the total number of requests and the percentage of requests sent to each data center.

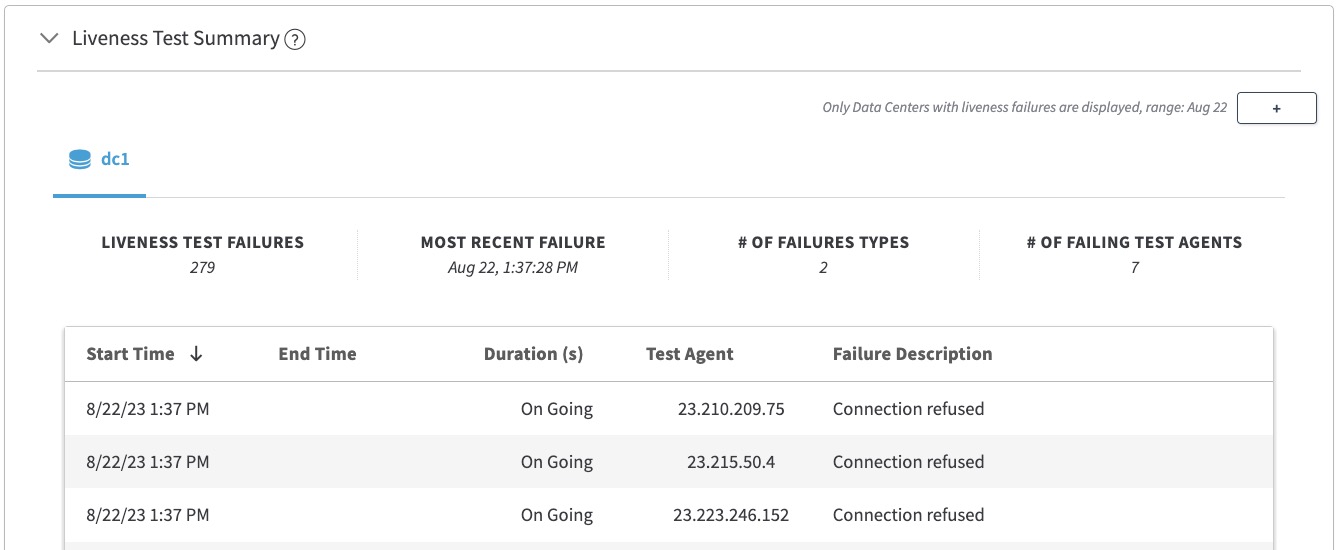
Liveness Test Summary
This table displays all errors to liveness tests for the current day. To include data from the previous day, click the plus (+) button.
If a data center has errors, the table includes a tab where the following information is provided;
- The duration of the failure or whether the failure is ongoing.
- The specific testing agent on which the error occurred.
- The reason for the error.

Data centers with no errors during the current or previous day are not shown and do not have a tab.
Updated 4 months ago
