Alerts
Use mPulse alerting to track changes to your website. Get timely notifications about your visitors' experience.
mPulse alerts are notifications that you define. Alerts help you to detect and identify performance issues on your site. With mPulse alerting, you can set up alert conditions using the mPulse built-in data attributes or custom attributes. For example, a threshold at a specific severity level on page load time or a beacon count. If the app or domain exceeds the threshold, the alert triggers and mPulse notifies the operations team.
You can add data attributes and dashboards to notifications. Use email, PagerDuty, Webhook or Slack to deliver your alert notifications.
Alert types
mPulse includes the following alert types.
Static
With static alerts you can set up a threshold-based alert that translates a concept like "The servers are down." or "The pages are too slow." into specific conditions that trigger notifications to your operations team.
A red icon next to the alert means that the incoming data meet the threshold condition that you set for the alert. The alert stays red until the condition no longer applies. For example, if you change the threshold or the data no longer meet that threshold. The alert is green as long as the incoming data does not meet the alert threshold condition. You can embed alerts in your custom dashboards with the Alerts History widget.
Anomaly detection
With anomaly detection, you select a metric to be monitored and the system determines the specific conditions that trigger an alert based on real data and send a notification to your operations team when an alert is triggered.
Similar to the static alert, a red icon next to the alert means that the incoming data does not lie within the determined range of normal behavior. The alert stays red until the condition no longer applies.
The mPulse Alert API lets you trigger and clear alerts from an external source using a service call. For example, if mPulse detects an anomaly from a third-party, a webhook URL call triggers an alert.
After you create and save an alert, it appears in the Alert Definitions menu Alerts tab of the mPulse interface:
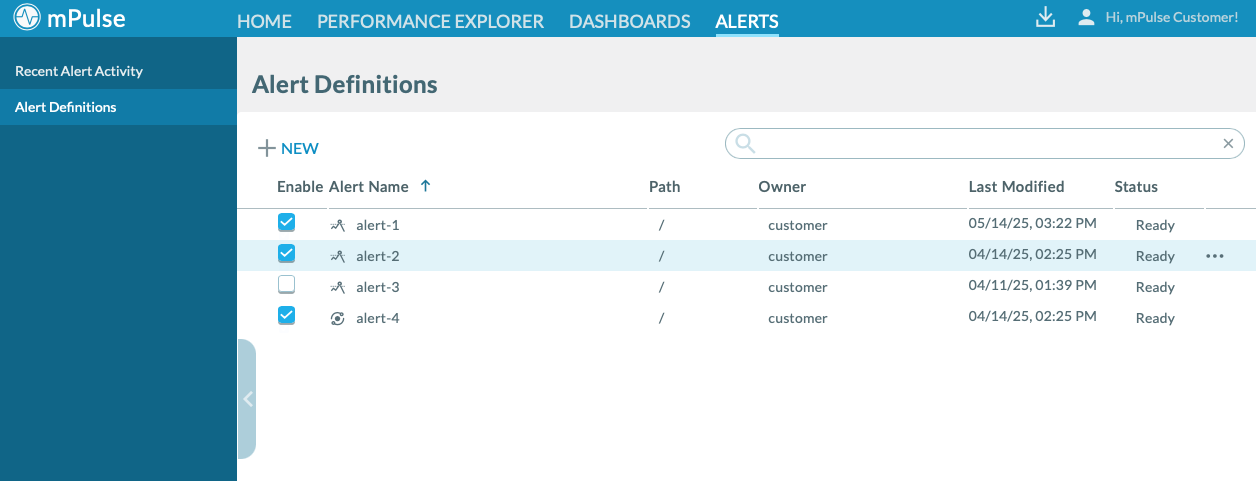
mPulse gives you ready access to a variety of user and administrative actions such as change owner and permissions. Click the ⋯ menu next to each alert to see the available actions.
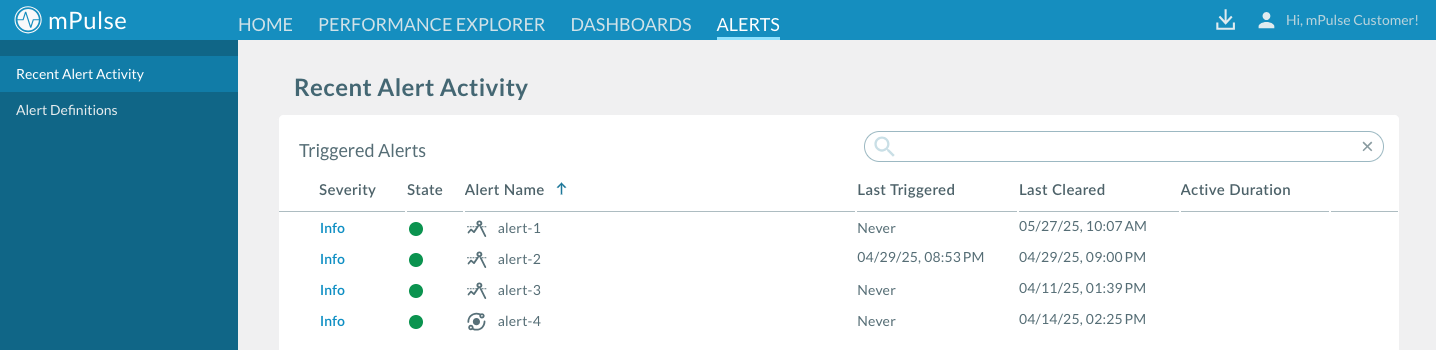
The Recent Alert Activity tab lists the alerts that have triggered over time. To sort the columns, click on the headings. Legacy alerts are only visible to Akamai approved tenants. For more information on legacy alerts, contact your account representative.
Create a static alert
Translate a concept like "The servers are down." or "The pages are too slow." into specific conditions that trigger notifications to your operations team.
How to
-
In mPulse, click on the Alerts tab and go to Alert Definitions from the menu on the left.
-
Click + New under the menu heading to open the wizard where you can create an alert.
-
On the Create a new Alert screen, choose Static Threshold.
-
Give the alert an unique Name
-
Choose the App to monitor.
-
Choose the Alert Severity (Info, Low, Medium, High).
The meaning of the severity levels is up to you. If you're going to use different severity levels, it's best practice to define the alerts. Let individuals and teams responsible for alerts know about the definitions.
Now, set up the alert's scope and condition in the section below.
Set up the scope and condition
Tell mPulse where and how to look for potential performance issues. Use rule expression attributes to form the event condition that triggers the alert. Give mPulse a time window to watch for the event.
How to
-
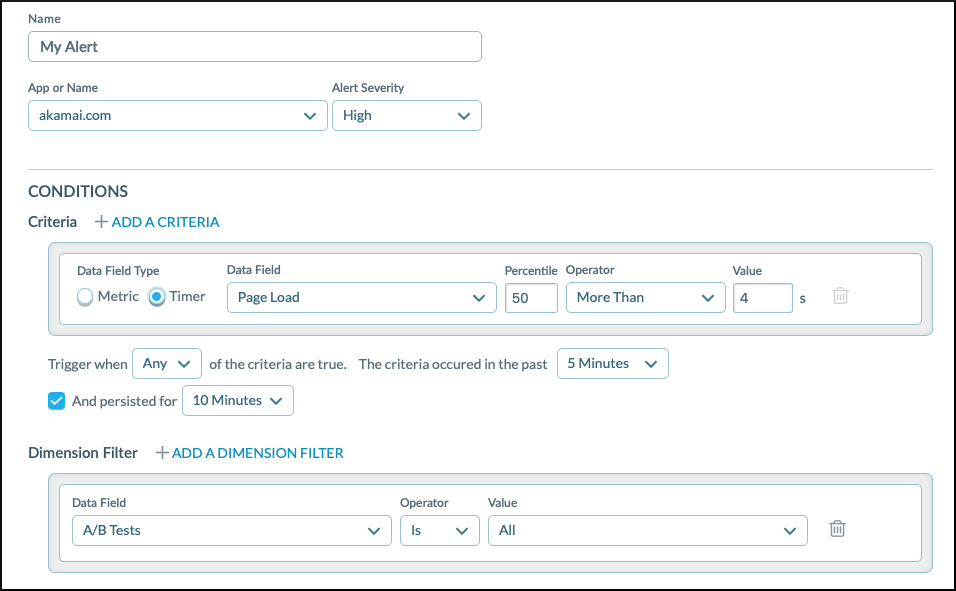
In the Conditions section, edit the existing criteria or click + New to add a new one.
-
Choose the Data Field Type, either Timer or Metric.
-
Configure the alert condition.
For each Timer:
1. In Data Field, choose an mPulse built-in timer, such as **Time to Visually Ready**, or a custom timer.

2. Enter a data percentile that will result in launching the alert. The preset is 50.

3. Select an operator.

4. Enter a value for the timer.
For each Metric:
1. In Data Field, choose an mPulse built-in metric, such as Bounce Rate, or a custom metric. 2. Select an operator. 3. Depending on the metric selected, enter a count or whole number. 4. If applicable, enter a duration time. -
Choose if the alert should launch for All criteria or Any. You can also optionally define if the criteria occurred some time back or persisted for a given time.
Think of these as logical operations. All is equal to and. All tells mPulse to trigger the alert when the criteria (in succession) meet the condition. Any is equal to or. Any tells mPulse to trigger the alert when one or more of the criteria meet the condition. -
In the Time Options section, choose a time window to track when an event breaches the threshold.
You can configure the day of the week, and specify the time window in a time zone of your choice. Consider adding a buffer to prevent transient, undiagnosable events from triggering an alert.
NoteUsing a shorter time means fewer data points to calculate the percentile. A longer time lengthens the time between the event and the notification.
-
If you'd like to refine the condition, add a Dimension filter:
a. Click + Add a dimension filter.
b. Choose a Data Field from mPulse built-in and custom dimensions.
c. Specify an Operator and the Value.
After setting up the conditions and the scope of alerts, you're ready to Set up alert notifications.
Configure anomaly detection
Anomaly based alerts use a statistical data model to identify atypical website performance.
With the mPulse anomaly detection feature, you don't have to set static thresholds for alerts. mPulse employs a statistical model that represents a normal behavior range based on historical data for your web users, and triggers an alert when conditions fall outside of that range. When you configure anomaly detection it can take up to 30 minutes for the alert to be created. In order to create an alert with anomaly detection mPulse needs a minimum of 14 days of data to create the initial model, then automatically retrains its detection model based on new data every 30 days.
Anomaly based alerts are useful when you don't have a specific target static threshold value to monitor. You can implement fewer alerts to monitor your site, because mPulse employs logic that accounts for traffic trend fluctuations throughout the day or week.
How to
-
In mPulse, click on the Alerts tab and go to Alert Definitions from the menu on the left.
-
Click + New under the menu heading to open the wizard where you can create an alert.
-
On the Create a new Alert screen, choose Anomaly Detection.
-
Give the alert an unique Name
-
Choose the App to monitor.
-
Choose the Alert Severity (Info, Low, Medium, High).
The meaning of the severity levels is up to you. If you're going to use different severity levels, it's best practice to define the alerts. Let individuals and teams responsible for alerts know about the definitions.
Now, let's move to configuring the conditions of an anomaly.
Set up the scope and condition
In the Conditions section of the alert wizard, you can define conditions that trigger an anomaly.
How to
-
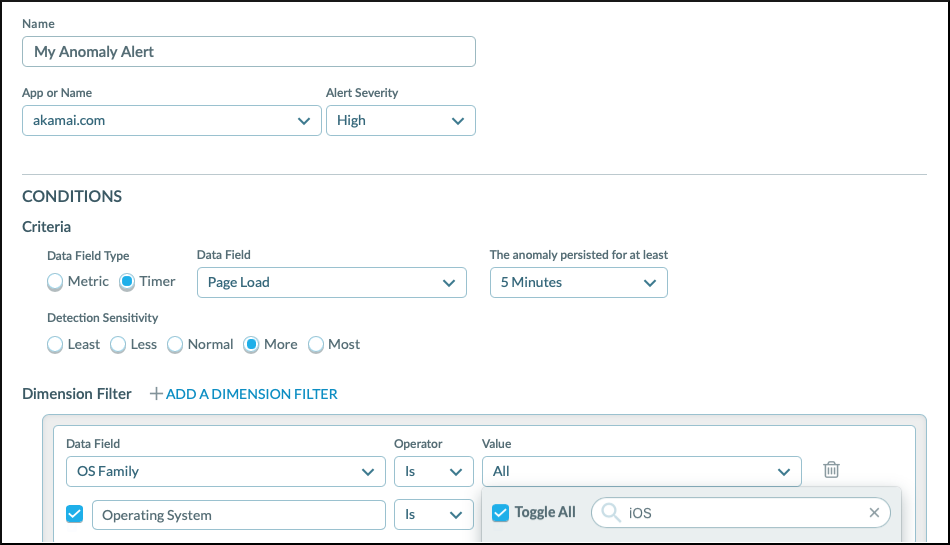
In the Conditions section, edit the existing criteria or click + New to add a new one.
-
Choose the Data Field Type, either Timer or Metric.
-
Choose how long the anomaly must persist (in minutes) in order to trigger an alert in The anomaly persisted for at least.
-
Choose the Detection Severity (Least, Less, Normal, More, Most). The default setting is Normal.
TipKeep the default setting initially. If you find the alert firing too frequently or not frequently enough, use the slider to adjust sensitivity.
-
If you'd like to refine the condition, add a Dimension filter:
a. Click + Add a dimension filter.
b. Choose a Data Field from mPulse built-in and custom dimensions.
c. Specify an Operator and the Value.
NoteOnce you have configured anomaly detection a colored icon is displayed next to the alert in the Recent Alert Activity menu to indicate the alert status.
- Orange - Pending creation. When you first configure anomaly detection it may take up to 30 minutes for the alert to be created. During this time the icon is orange.
- Red - The incoming data does not lie within the determined range of normal behavior. The alert stays red until the condition no longer applies.
- Green - The incoming data falls within the determined range of normal behavior.
After setting up anomaly triggers, you're ready to Set up alert notifications.
Set up an alert notification
Communicate performance issues to your colleges and operations team.
For both the static alerts and anomalies, you can set up notifications for email, Webhook, Pagerduty, Slack, or create an annotation. You need to configure at least one notification type for your alert.
How to
- Click + Add an action to configure a new notification. You can also add a new notification type and delete or edit the default one.
- Select a notification type (email, Webhook, Pagerduty, Slack or mPulse annotation). Specify the details that you want to include in the notification:
- Send an Email. Lets you use e-mail for notifications.
NotemPulse auto-fills your email address in the To field and the severity level and the alert's name in the Subject line. You can remove or change this information if you want.
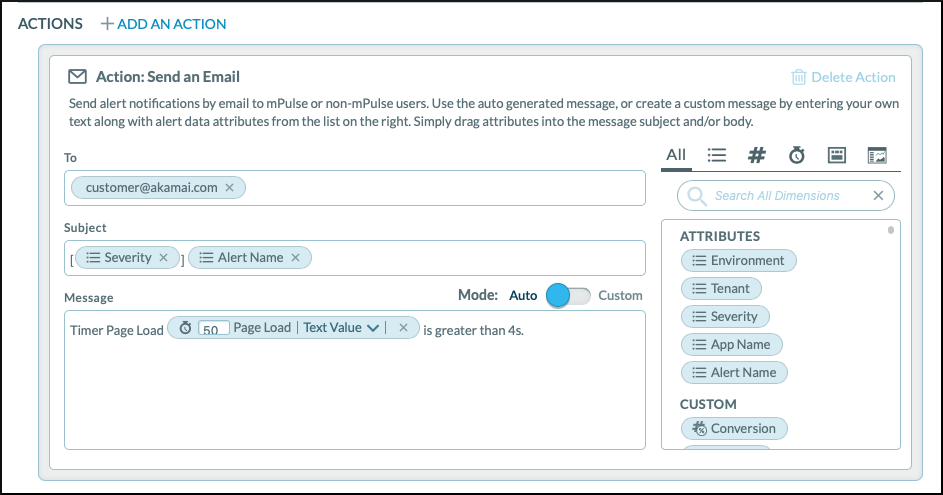
To set up an email notification:
-
Choose Send an Email
-
In the To field, enter the email addresses of the users you want to receive the notification.
-
In Subject, compose the heading for e-mail notifications.
-
In Message, enter the text that you want to include in the email.
-
Use the Mode slider to get Auto messages that mPulse generates based on your configuration, or Custom to edit the template as you want.
-
From the list on the right, you can drag attributes and dashboards that you want to include in the notification to the Message field. An attribute's value at the time of the alert appears in the text. Dashboards appear as links or as images in the text.
- Call Webhook. Lets you use a web service call for notifications.
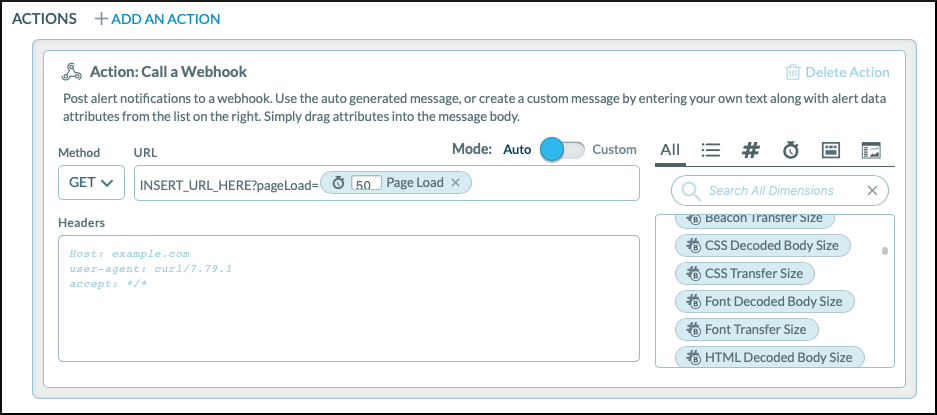
To set up a Webhook call:
-
Use the Mode slider to get Auto URL query parameters and headers that mPulse generates based on your configuration, or Custom to edit the template as you want.
-
Select the Method to call the webhook. mPulse supports
GET,POST,PUT,DELETE, orHEAD. -
In the URL field, enter the URL for the webhook.
-
In the Headers field, enter the required headers for the webhook URL.
Webhook calls from mPulse Alerts now include a User-Agent string in the
mPulse Alerts/<version number> format. If you want to override the default value, enter your custom User-Agent HTTP header in this field. -
From the list on the right, you can drag attributes and dashboards that you want to include in the notification to the Message field. An attribute's value at the time of the alert appears in the text. Dashboards appear as links or as images in the text.
NoteWhen using the POST or PUT method, you can add text and drag attributes and dashboards to the request body.
- PagerDuty. Lets you use the PagerDuty service for notifications.
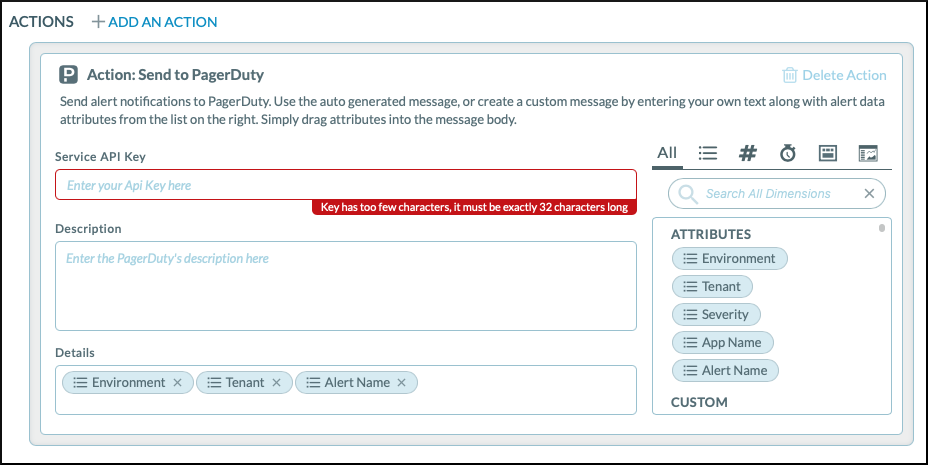
To set up a PagerDuty service.
-
In the Service API Key field, enter your PageDuty Events API integration key. For instructions on how to retrieve your integration key, visit PagerDuty Events API: Getting Started.
-
In Description, Enter a descriptive comment about the notification if you want.
-
From the Attributes list, drag the attributes that you want to include in the notification to the Description field. An attribute's value at the time of the alert appears in the text. An attribute's value at the time of the alert appears in the text.
-
From the list on the right, you can drag attributes and dashboards that you want to include in the notification to the Message field. An attribute's value at the time of the alert appears in the text. Dashboards appear as links or as images in the text.
-
In the Details field, select the items that you want to include in the notification. Environment, Tenant, and the Alert Name are preset. Deselect them if you don't want this information to appear in the notification.
- Slack. Lets you integrate with Slack instant messaging for notifications.
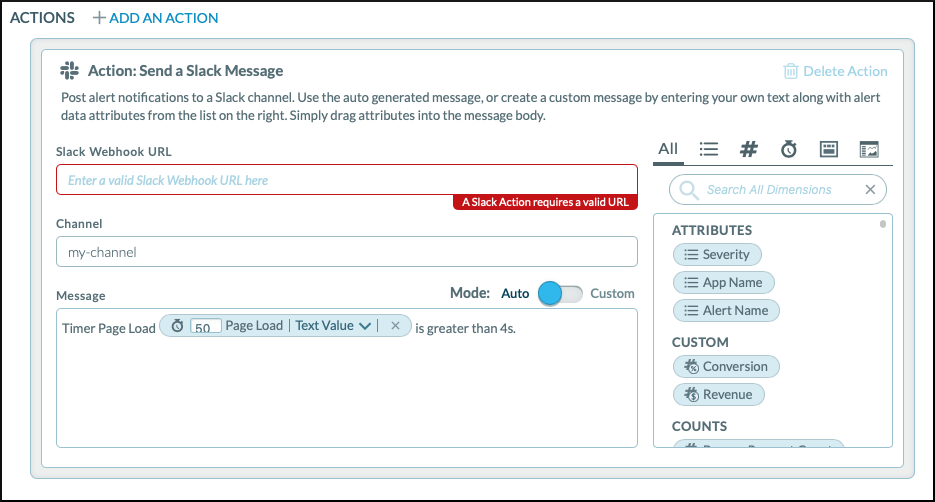
To set up a Slack notification:
-
Enter the incoming Slack Webhook URL. For instructions on how to set up an incoming webhook, visit Incoming WebHooks for Slack.
-
In the Channel field, enter the channel name in Slack where you want the notification to appear.
-
Use the Mode slider to get Auto URL query parameters and headers that mPulse generates based on your configuration, or Custom to edit the template as you want.
-
In Message, enter the text that you want to include in the email.
-
From the list on the right, you can drag attributes and dashboards that you want to include in the notification to the Message field. An attribute's value at the time of the alert appears in the text. Dashboards appear as links or as images in the text.
For more information on integrating with Slack, visit Slack API: Incoming WebHooks.
Manage alerts and reports
mPulse gives you ready access to a variety of user and administrative actions. Use this feature to edit, duplicate, export, and delete the alerts you created.
After you create and save an alert, it appears in the Alert Definitions menu Alerts tab of the mPulse interface:
mPulse gives you ready access to a variety of user and administrative actions such as change owner and permissions. Click the ⋯ menu next to each alert to see the available actions.
Actions include:
NoteSome actions may not be available for all objects in mPulse.
- Delete
- Duplicate
- Export
- Open (and edit)
Turn notifications on or off
When you first create an alert or a report, mPulse turns on (enables) the notification for you.
To change the notification status of an alert or a report:
-
In the mPulse, click the Alerts tab and go to Alert Definitions.
-
In the list, find the items that you want to control the notification for.
-
In the Enable column, select the checkbox to turn on the notification, or deselect the checkbox to turn off the notification. The new setting is now active.