Real user monitoring (classic) reports replaced by mPulse dashboards
Real user monitoring (classic) reports are to be discontinued on May 31, 2023. In place of these reports you can use mPulse, an advanced real user monitoring (RUM) application that helps you understand how real users are experiencing your website's performance.
mPulse is a much more powerful tool than the real user monitoring (classic) report. mPulse allows you to customize the specific data, metrics, and timers that are relevant to your business and generate a greater level of granularity to give you insight into your website's performance.
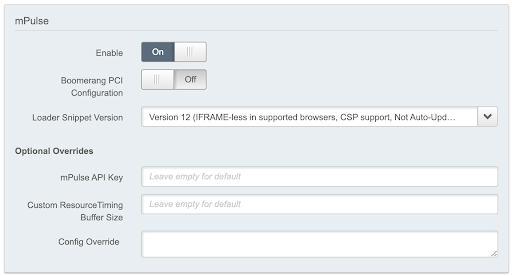
To use mPulse to access the same content and data that your real user monitoring (classic) reports provided, you need to enable the mPulse behavior in Property Manager so that mPulse collects your real user monitoring metrics.
How to
- In Property Manager under Property Configuration Settings locate the mPulse behavior switch and set it to "Enable."

- If your site needs to comply with the PCY Data Security Standard (DSS), set the Boomerang PCI Configuration setting to "On."
Now that you've enabled the mPulse behavior in Property Manager, mPulse now collects your RUM metrics.
Note:We recommend that once you confirm mPulse is collecting your RUM metrics, you disable the existing Real User Monitoring (RUM) behavior in Property Manager. Eventually, RUM reports will be discontinued entirely and disabling the behavior in Property Manager beforehand will ensure a smoother transition when it is discontinued.

Which mPulse dashboards replace the RUM reports
mPulse provides system dashboards with preconfigured widget selections. Use these dashboards as a starting point to build and customize your own dashboards. See View widget settings to get started with mPulse widgets.
| Data available | RUM report (old location) | mPulse dashboard (new location) |
|---|---|---|
| Summary report | Summary dashboard Overview dashboard |
| Dimension report | Dimensions dashboard |
| Comparison report | Use the default comparison functionality with mPulse widgets. |
In mPulse you can create a custom dashboard to show any combination of data so it’s possible to create the same layout as you had in the legacy RUM Summary report, directly in mPulse. mPulse widgets allow you to perform custom comparisons across any date range.
See the Property Manager documentation on the mPulse behavior if you need more information on how the behavior works or PCI compliance.
Updated 9 days ago
