Realtime reports
Realtime NetStorage reports allow you to view space used volume, object count, average object size information and uploads and downloads from and to NetStorage storage CP codes with a 10 minute latency.
The reports open with a dashboard for each report type. Data in the reports is available for query for 60 days and at a day's aggregation.
The Realtime reports dashboard uses specific parameters as metrics and dimensions. Use these metrics to help manage data in your reports.
Access these reports in Control Center
- Select the appropriate Control Center Account. Use the top-right pull-down in the header to select the account.
- Open the application. Go to ☰ > ORIGIN SERVICES > NetStorage > Reports, and then select NetStorage - Reports > Realtime from the menu.
- Pick a "tab" to review desired reports data.
Realtime Aspera reports
View traffic trends, file counts and volume of content transferred using Aspera.
Realtime reports for Aspera derive data from sample data sets. The Aspera tab displays this data at a latency of under 15 minutes.
About the available widgets
Each individual content panel in the reporting tabs is referred to as a "widget." Several widgets make up this tab, including the following:
The "Resolution {time increment}" for each widget indicates how frequently data is gathered.
| Widget | Description |
|---|---|
| Traffic Trend | This trend chart widget provides information on the average volume of content transferred using Aspera. |
| Success File Count | This trend chart widget provides information on the successful file transfers using Aspera. |
| Volume By Cpcode | This tabular chart provides information on the total size of content uploaded and downloaded through NetStorage for a CP code. You can choose to toggle between chart and table views. |
You can also set a Time and Timezone for this report. However, certain time zones may not work with this report because data is collected on an hourly basis using the UTC time zone.
Realtime traffic reports
Realtime traffic reports provide information on the number of hits, the bandwidth at which the media was available, and information on volume and hits per Content Provider (CP) code.

About the available widgets
Each individual content panel in the reporting tabs is referred to as a "widget." Several widgets make up this tab, including the following:
| Widget | Description |
|---|---|
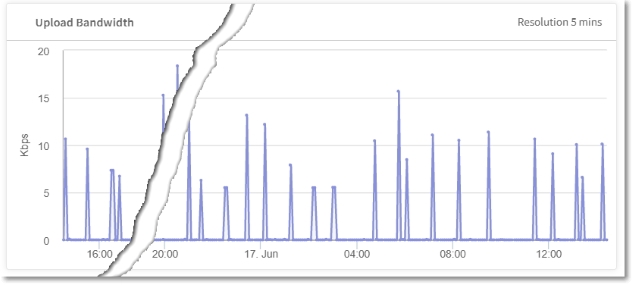
| Upload Bandwidth | The average volume of content uploaded per second to NetStorage for a given time period. This metric is available at a minimum granularity of 5 minutes. |
| Download Bandwidth | The bandwidth downloaded from NetStorage for a given time period. You can choose from data for a day to up to 60 days. The aggregation rate changes accordingly from 5 minutes to an hour. |
| Volume By Cpcode | This tabular chart provides information on the total size of content uploaded and downloaded through NetStorage for a CP code. |
Realtime availability reports
Availability reports provide information on success and error responses for content uploaded to NetStorage for Content Management, and for Delivery Download across all CP codes.

About the available widgets
Each individual content panel in the reporting tabs is referred to as a "widget." Several widgets make up this tab, including the following:
| Widget | Description |
|---|---|
| Content Management Hits | The total number of hits to NetStorage indicating upload or download operations performed. Depending on the date range chosen, Resolution is set to 5 minutes, 1 hour or 1 day with smaller date ranges taking lesser time for aggregation. |
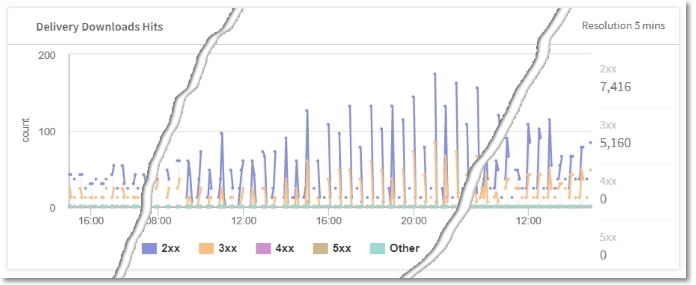
| Delivery Download Hits | The total number of hits by end users on content stored in NetStorage. Depending on the date range chosen, Resolution is set to 5 minutes, 1 hour or 1 day with smaller date ranges taking lesser time for aggregation. |
| Hits by Response Code | Information on hits from end-users on content stored in NetStorage that is categorized by response code, content management and delivery downloads hits. |
| Content Management Hits by CP Code | Information on hits from end-users on content stored in NetStorage that is further categorized by CP code, content management, and response codes. |
| Delivery Downloads Hits by CP Code | Information on hits from end-users on content stored in NetStorage categorized per CP code. |
Realtime read & write operation reports
Use the Read & Write Operations tab to view reports about throttled operations on a CP code basis. Operations that exceed the threshold for a given CP code or region are throttled.
All storage operations are subject to rate limiting checks before the object is written to, or read from storage. These operations are either a ‘read’ or ‘write’ operation. These reports provide near real-time feedback on these operations with a 2 minute latency. Each data point on the widget has a resolution time of five minutes. These limits apply to the CMS APIs and Download Delivery of all objects, including files and directories See operational and rate limits for more information.

About the available widgets
Each individual content panel in the reporting tabs is referred to as a "widget." Several widgets make up this tab, including the following:
| Widget | Description |
|---|---|
| Read Operations That Exceed Threshold | Identifies the total read operations that exceeded the threshold for the given time period. |
| Read Operations Throttled | Identifies the total read operations per second over the threshold. |
| Write Operations That Exceed Threshold | Identifies the total write operations that exceeded the threshold for the given time period. |
| Write Operations Throttled | Identifies the total write operations per second over the threshold. |
| Total Read Operations | Information on the total number of NetStorage read operations, categorized by CP code. |
| Total Write Operations | Information on the total number of NetStorage write operations, categorized by CP code. |
Updated 2 months ago
