Manage data in your reports
You can customize how you want to display report data and perform other operations with your reports. This includes setting date ranges and filtering report data, as well as emailing and downloading complete report data.
When you first access a report, each widget may be empty and display "No data." This can happen for multiple reasons:
- The range of time set. There may be no data for the default range of time. Try using a different time range.
- The filters set. The default filters may cause no data. Refine the output by updating the filters.
- A setting may need to be enabled. You may need to enable a separate setting for the product in question. (For example, "User agent strings" need to be enabled and logged for some reports.) See the specific topic for that report's tab for more details.
Set the date/time range for a report
You can filter report output to a specific date range, and in some cases to a specific time.
Click the date range field to set a range of time you want for report data. You can query a report only for the period in which data has been available for its metrics and dimensions.
- Select date ranges for your Start date and End date. Some reports offer Pre-Defined ranges you can select that will automatically apply to the calendar.
- If applicable, set a Start Time, End Time, and a Timezone. The timezone setting defaults to your local timezone.
- Click Apply.
Consider the timezone when setting a time
Various reports dashboards also let you refine report data by time and timezone. This defaults to the timezone associated with the active Control Center account.

Certain timezones may not work with some report's tabs, for example, the various "Traffic" and "Unique Viewers" reports. This is because report data is collected on an hourly basis using the UTC timezone.
Filter data for a report
You can filter the data to isolate it by specific parameters.
Click the filter icon ( ). The available filters vary based on the specific report. See the Filter for report section in each specific "{Report name} tab" topic for details on available filters.
View details in a chart
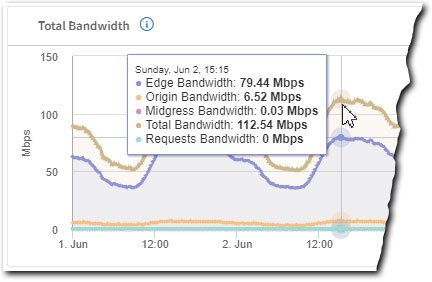
When in chart view (), you can interact with the chart to view detailed data.
You can view "point in time" data in a chart
Mouse-over a point in a chart to see data from that specific date and time. Time increments revealed are based on the resolution interval of that report.

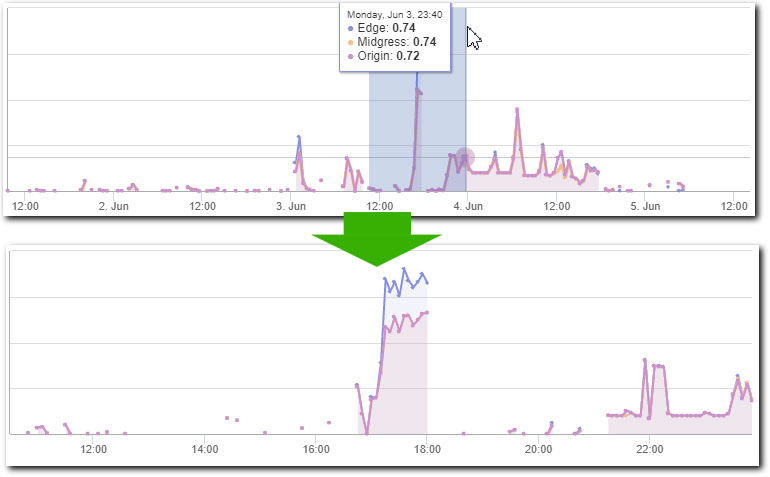
Zoom into a chart
Certain widgets let you "zoom in" on a section of a chart to view a range of detail. Click and drag the desired section of the chart to expand it.

To return to your original time frame, use the date range field to reset the date/time.
Sort data in a table
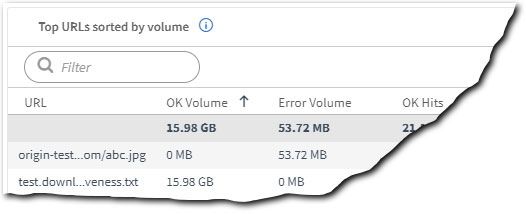
You can sort data in widgets in ascending or descending order when in Table view.
When you mouse over a column heading in a widget, an arrow icon appears that lets you sort by that column's data. Click a down arrow () to sort in descending order, and an up arrow () to sort in ascending (default). The column in a table that is labeled with a static arrow determines how the table is currently sorted.

Email report data
Some reports allow you to email output data as an HTML or a CSV file.
Not all reports can email data. Typically, reports that present "realtime" data don't offer this feature.
Set up a new email report
- Set the desired range of time.
- Set the desired filters.
- Click Email Report ().
- Click Create Report and set options as necessary:
- Report Name. Input a desired name for the report. This is how it's listed in the table after creation.
- Report. Defaults to Current Dashboard.
- Format. Select the desired format for the report, HTML or Comma-separated values (CSV).
- Email to. The email associated with the current Control Center account is added by default. Input a full email addresses and press Enter to add it. Repeat to add more addresses.
- Frequency. Determine a frequency for the email. Leave it at the default, Send Now to only send it once.
- Date range. You can set the range here, but we recommend doing it beforehand (Step 1). This way, you can verify the report data before sending the email.
- Filters. This displays the current number of filters applied. You can click the link to modify the filters if desired.
Other operations
- Edit () or delete (). You can manage an existing report in the table.
- Take ownership. Take ownership of a report ( ... > Take Ownership ) that another user created to administer it.
- Suspend a report. You can suspend ( ... > Suspend ) a recurring report to stop it from generating additional emails in the future.
Download report data
Some report dashboards offer the Download Report button you can use to download data.
If a report dashboard offers this button, click it to download data as a comma separated value (.csv) file.

A separate window is launched. Use it to customize the data in the downloaded report. For example, you can select the desired report widget, and modify the date range and filters. The date range and filters you currently have set for the report are applied by default.
Individual widgets for some reports offer a unique instance of this button that you can use to quickly download .csv data. This is noted in the topic for each applicable report.
Updated 11 months ago
