Historic reports
The Historic reports dashboard uses specific parameters as metrics and dimensions. Use these metrics to help manage data in your reports.
Access these reports in Control Center
- Select the appropriate Control Center Account. Use the top-right pull-down in the header to select the account.
- Open the application. Go to ☰ > ORIGIN SERVICES > NetStorage > Reports, and then select NetStorage - Reports > Historic from the menu.
- Pick a "tab" to review desired reports data.
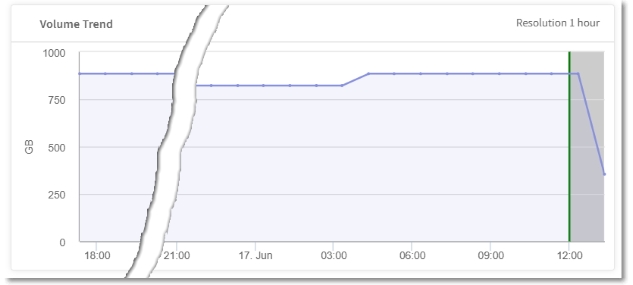
View NetStorage volume trends
Display the total amount of storage utilized in NetStorage across all CP codes for a 48-hour period.
About the available widgets
Each individual content panel in the reporting tabs is referred to as a "widget." Several widgets make up this tab, including the following:
| Widget | Description |
|---|---|
| Average Volume | Displays the average volume for the filtered duration. |
| Volume Trend | This trend chart widget provides information on the average volume of content uploaded per second to NetStorage for a given time period. |
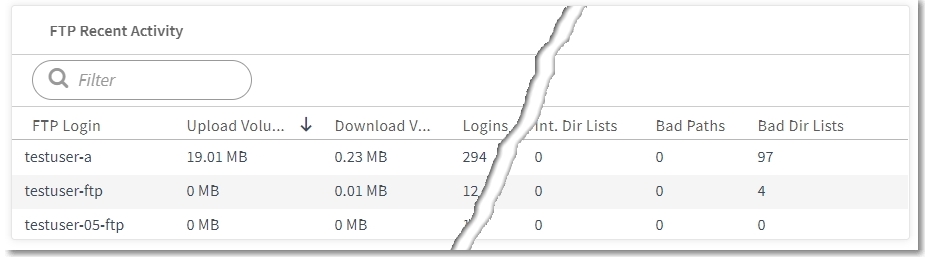
View recent FTP activity
Historic reports of recent FTP activity through NetStorage.
About the available widgets
Each individual content panel in the reporting tabs is referred to as a "widget." Several widgets make up this tab, including the following:
| Widget | Description |
|---|---|
| FTP Recent Activity | Displays the recent FTP activity. |
The "Resolution {time increment}" for each widget indicates how frequently data is gathered.
Updated 27 days ago