Aggregated reports
An aggregated report is a custom report that collects traffic data based on up to four user-defined variables and compiles it into data summaries. It allows you to view aggregated data registered under one CP code for a selected period of time that is no longer than 90 days. You can have two active aggregated reports for an OTA Updates property.
Search options
The aggregated report shows aggregated data registered under a selected CP code. You can select a CP code from the CP code drop-down at the top of the OTA Updates page.
To search for your aggregated data or limit the aggregated data presented, you can use the following filters:
-
Report name

List of all active and inactive instances of aggregated reports. It shows instances of aggregated reports under report names specified when configuring aggregated reporting behaviors in Property Manager, or under report names specified in the aggregated report details if you edited the original report name.
Inactive reports are accessible for 90 days.
-
Date range

An inclusive set of dates associated with a particular aggregated report, for which aggregated data is presented. By default, the range is set to a period of one month from the current date.
Aggregated report details
You can view and edit the details of an aggregated report by selecting the aggregated report in the report name field and clicking Edit.
In the aggregated report details window, you can:
-
View the source configuration of the aggregated reporting behavior within a property.
The following data types are available:
-
Property name.
The name of the property configuration file. -
Data sources.
The name of the data source specified in the aggregated reporting behavior. -
Property version.
The versions of the property used to generate the aggregated report. The following statuses are available:-
Active. Indicates the active version used to generate the aggregated report.
-
Inactive. Indicates an inactive version used to generate the aggregated report.
For each version, you can view the date and time of a first activation, last activation, and last deactivation.
-
-
-
Edit attribute and report names of the aggregated report.
The following data types are available:
-
Report name
The name of the aggregated report. By default, this field displays the source report name specified in the aggregated reporting behavior.
Editing the report name enables easy search and identification of the aggregated report. It does not change the source report name specified in the aggregated reporting behavior. -
Attribute 1-4
The names of attributes displayed in the aggregated report.
Editing attribute names enables easy identification of the attributes in the aggregated report. It does not change the source attribute values configured in the aggregated reporting behavior.
-
Aggregated report details with two attributes

Aggregation attributes
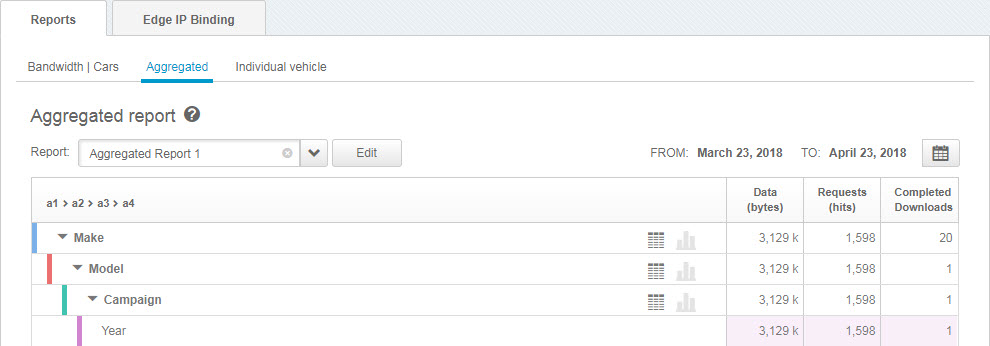
The defined aggregation attributes are organized into expandable and collapsible groups. Within a group, each level of a tree hierarchy has a color and represents a particular aggregation attribute. The nesting order of aggregation attributes reflects the order that you added them when you configured the aggregated reporting behavior. For each attribute, the following aggregated data types are available:
-
Data (data)
The amount of data in bytes sent over the Akamai network. -
Requests (hits)
The number of requests for a file. -
Completed Downloads
The number of complete downloads as defined by the download complete marker behavior.
An aggregated report grouped by: make, model, campaign, and year

Aggregation data views
You can present aggregated data in the following views:
-
Tabular view

Shows numerical data in an aggregated form for an attribute value. -
Graphical view

Shows percent stacked bars for an attribute value with child elements. Each stacked bar represents an aggregated total for the selected attribute value per aggregated data type (data, requests, completed downloads), where all immediate child elements of the attribute value are expressed as the percentage of the aggregated total.
An aggregated report by make and model in a graphical view

In the example, Model 1, Model 2, and Model 3 are child elements of the Make attribute value. The tooltip over the Request (hits) bar reveals that Model 1 makes up 13.14 % of all requests, Model 2 makes up 24.92% of all requests, whereas Model 3 makes up 61.94% of all requests. The sum of the three figures is the aggregated total of all requests for the parent Make attribute value, which equals 17836.
Updated 8 days ago
