Metrics
The MSL5 Metrics Dashboard provides a visual display of service metrics, enabling the monitoring and analysis of traffic patterns through an organized dashboard interface.
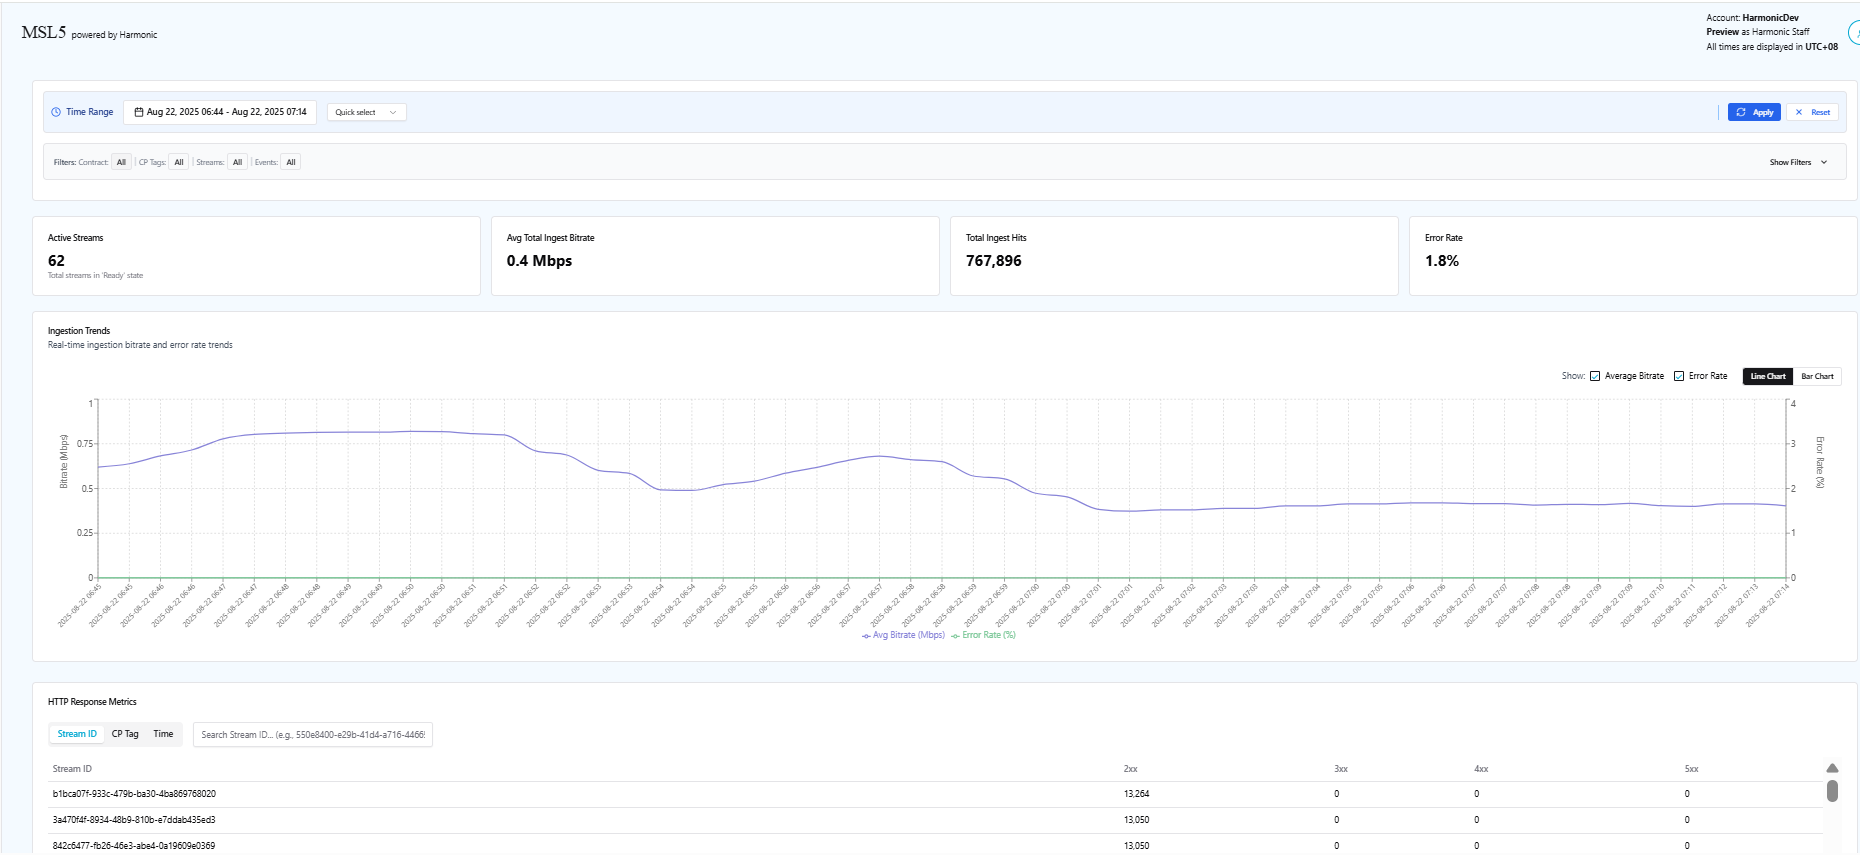
MSL5 Dashboard tracks the following core metrics:
- General Metrics: Active Streams, Avg Total Ingest Bitrate, Total Ingest Hits, Error Rate
- Ingestion Trends
- HTTP Response Metrics
- Stream and Event Details
View and Filter the Metrics
-
Log in to your MSL5 account and select ☰ > Metrics.
-
Set the Time Range:
- Custom time range: Specify the range from the date range picker (within 31 days from the current time).
- Quick Select time range: Select a designated time range from the drop-down menu.
-
From the Filter panel, click Show Filters to expand the filters and select the desired parameters for the filters as follows:
- Contract ID: Select the desired Contract ID(s) from the drop-down menu.
- CP Tag: Select the desired CP Tag(s) from the drop-down menu.
- Stream: Select the desired stream(s) from the drop-down menu.
Stream is the primary and mandatory filter for querying data. Contract ID and CP Tag serve only as helper filters to assist in finding the correct Stream ID and do not affect the actual query payload.
- Event: Select the desired event(s) from the drop-down menu. Note that you need to select the stream first where the event is clipped to.
-
Click the Apply button to view the metrics based on your selected filters.
After clicking the Apply button, a progress bar will appear, indicating the status of the loading metrics along with the number of metrics being loaded.
If a long time range is configured, it may take longer to load all metrics until the message “All metrics loaded successfully” is displayed.
General Metrics
View the following general metrics:
- Active Streams: Displays the total number of streams in the “Ready” state.
- Avg Total Ingest Bitrate: Displays the average total ingest bitrate over 60-second intervals, measured in Mbps.
- Total Ingest Hits: Indicates the total count of ingest requests.
- Error Rate: Displays the error count per total requests in percentage.
Ingestion Trends
View the real-time average ingestion bitrate and/or error rate trends with Line Chart and Bar Chart views based on the following:
- Average Bitrate (Mbps)
- Error Rate (%)
HTTP Response Metrics
Retrieve the HTTP (2xx, 3xx, 4xx, 5xx) response metrics based on searches conducted using the following criteria:
- Stream ID: Metrics based on the Stream ID you input.
- CP Tag: Metrics based on the CP Tag you provide.
- Time: Metrics based on the specified Time Range.
Stream and Event Details
Select up to 10 streams from the filter panel to view detailed metrics for streams and events with active data ingestion during the specified time range. If no matching record is found, the metrics will appear blank, accompanied by the "No data available" message.
Search by Stream ID, Event Name, or Rendition ID to view the following metrics:
- CP Tag: The Content Provider Tag identifier. For example, “1”.
- Stream ID: A unique stream identifier. For example, "c32e5312-ed7a-43b7-8681-fd5ace659a65".
- Event Name: The identifier for a specific event within the stream. For example, "event0619".
- Rendition ID: The identifier for a specific rendition or playlist. For example: "event0619/07-iframe.m3u8".
- Ingest Hits: The request rate for this rendition. The format is rate with unit "c/s" (calls per second). For example, "1.17 c/s".
- Ingest Bits: The bitrate for this rendition. The format is bitrate with appropriate units (Kib/s, Mib/s, Gib/s). For example, "13.5 Mib/s".
- Error Rate: The percentage of errors encountered for this rendition. For example, "0%".
Updated 5 months ago