Usage reports
The MSL5 Usage Report is a comprehensive analytics feature that provides detailed insights into system usage patterns. It enables users to monitor, analyze, and compare usage data across different usage cycles, contracts, and CP tags.
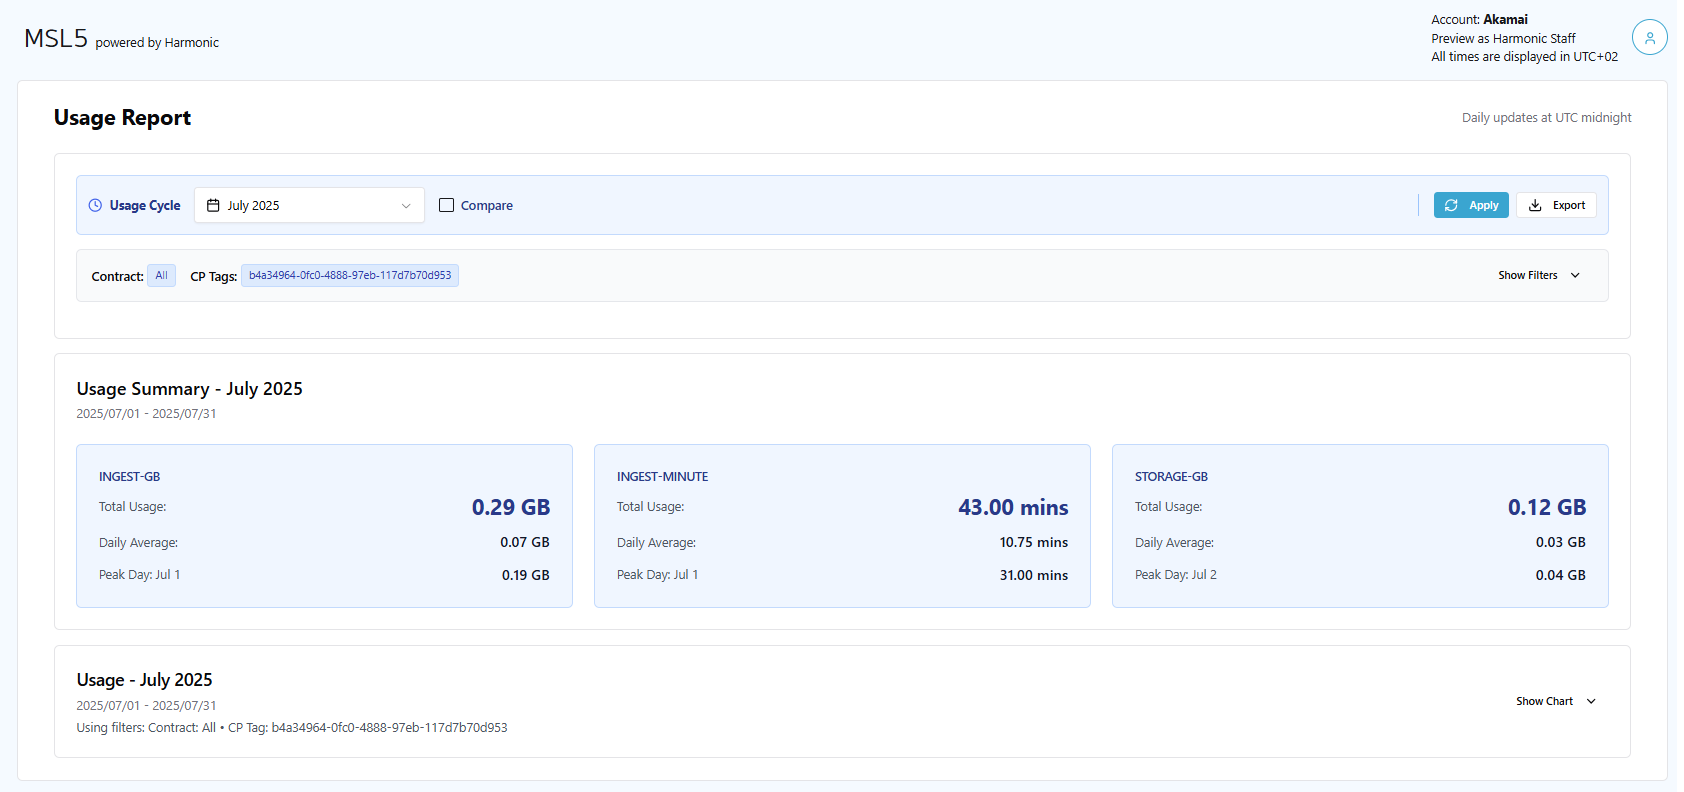
The Usage Report tracks three core metrics: Ingest-GB, Ingest-Minutes, and Storage-GB.
The data is organized into monthly usage cycles, allowing users to analyze patterns over time. Each cycle provides daily granularity, enabling detailed trend analysis and identification of usage spikes or anomalies. The Usage Summary provides at-a-glance insights for each metric:
- Date Range: Displays the cycle's start and end dates.
- Total Usage: Displays the sum of all usage for the selected period.
- Daily Average: Shows the average daily consumption for the metric.
- Peak Usage Day: Identifies the highest usage day and its value.
Users can select the usage cycle for the past 12 months. New data files are generated daily at 3:00 UTC by the analytics pipeline.
View and Filter the Usage Report
-
Log in to your MSL5 account and select ☰ > Usage Report.
-
From the Usage Cycle, select the available monthly reporting periods to focus analysis on specific timeframes.
-
From the Filter panel, click Show Filters to expand the filters and select desired parameters for the filters as follows:
- Contract ID: This can be used to filter data by specific contracts to analyze performance at the contract level. The list of available contracts originates from the account context of the user.
- CP Tag: This can be used to filter the content provider tags to segment data by content source or type.
- Usage Type: This can be used to differentiate usage during the MSL4 to MSL5 migration from the regular usage on MSL5. Options:
- Billable Usage: The billable usage refers to the standard usage of MSL5 that is billed to Akamai customers.
- Migration Usage: The migration usage refers to the usage during the soft migration phase from MSL4 to MSL5, which is not billed to Akamai customers.
-
Click the Apply button.
-
(Optional) Click on the Export button to export the desired Usage Report to a CSV file.
Smart Filter RelationshipsThe system automatically updates the available contracts based on the current account context and filters the available Contracts and CP tags, ensuring filter combinations are valid and meaningful.
Compare the Usage Cycles
The comparison feature enables side-by-side analysis of different usage cycles (e.g., July 2025 vs August 2025):
- Dual Cycle Analysis: Select two different usage cycles for direct comparison.
- Metric Comparison: View absolute differences and percentage changes across all three metrics.
- Flexible Filter Configuration: Apply the same filters to both cycles or use different filters for each comparison period.
- Visual Difference Indicators: Color-coded displays show increases (red) and decreases (green) in usage.
- Log in to your MSL5 account and select ☰ > Usage Report.
- From the first Usage Cycle, select the available monthly reporting periods to focus analysis on specific timeframes.
- Enable the Compare checkbox.
- From the new Usage Cycle, select the available monthly reporting period that is used for comparison.
- Click the Apply button.