OpenTelemetry
In order to make a system observable, it must be instrumented. Language specific implementation of OpenTelemetry provides a way to instrument your application without touching your source code. In this lab we're going to instrument a Java application.
Prerequisites
- This lab should be performed by a user designed as a platform administrator.
- Enable the following apps on the platform-level: Tempo, Otel, and Loki.
- Enable Grafana on the team-level.
- Follow the instructions below to enable tracing for Istio and
ingress-nginx-platform.
Enable tracing for Istio
-
Navigate to Apps in the main menu.
-
Click on the configuration icon for Istio.
-
Select the Values tab.
-
Click Edit and set the following values:
tracing: enabled: true samplingRatio: "100"Setting the
samplingRatioto100is only done for this lab to make sure all traces are sampled. In a production environment the ratio would normally be set to0.01. -
Click Submit.
-
Repeat step 2 to 5 for the
ingress-nginx-platformapp.
Sometimes instrumenting the nginx-ingress controller requires a restart of the pods. Restart the
ingress-nginx-platform-controllerPod if you don't see any traces from nginx.
Build an image from source code
For this lab we're going to use the Spring PetClinic Sample Application. Follow these steps to build an image from source code.
Add the code repository
-
In the left menu in the Console, navigate to Code Repositories.
-
Click on Add Code Repository.
-
Provide a name for this code repository. The name will be used to identify the code repository in App Platform. You can only use the name once within a Team. We are going to use the name petclinic for this code repository.
-
Select GitHub for the Git service.
-
Fill in the following Repository URL: https://github.com/spring-projects/spring-petclinic.git
-
Click the Add Code repository button.
Create the container image
-
In the left menu of the Console, click on Container Images.
-
Click on Create container image.
-
Select the BuildPacks build task.
-
Select the petclinic repository from the Repository drop-down list.
-
Select the reference main.
-
Optionally you can change the Image name and tag. This is the name and tag used to store the image in the private Harbor image registry.
-
Under Extra arguments, click Add argument. Enter the following arguments:
Name:BP_JVM_VERSIONValue:17
-
Click Create Container Image to finish the process.
Create a workload from the developer catalog
-
Go to Container Images in the left menu and click on the Add to clipboard of the petclinc image in the Repository column. Remember that the tag is main.
-
Go to Workloads in the left menu and click on Create Workload.
-
Select
k8s-deployment-otelfrom the catalog. -
Add the Name petclinic for the workload.
-
Leave the Auto image updater to Disabled.
-
In the workload values, change the following parameters:
image:
  repository: <paste from clipboard>
  tag: main
Because we're deploying a Java application here, maybe also change the resources:
resources: limits: cpu: 500m memory: 1Gi requests: cpu: 300m memory: 256Mi -
Click Submit.
Expose the service
-
In the left menu click Services then click on Create service.
-
Select the petclinic service from the Service Name drop-down list:
-
Click Create Service.
See traces
To be able to see traces, we'll first need to generate some requests. Click on the URL of the petclinic service and generate some requests.
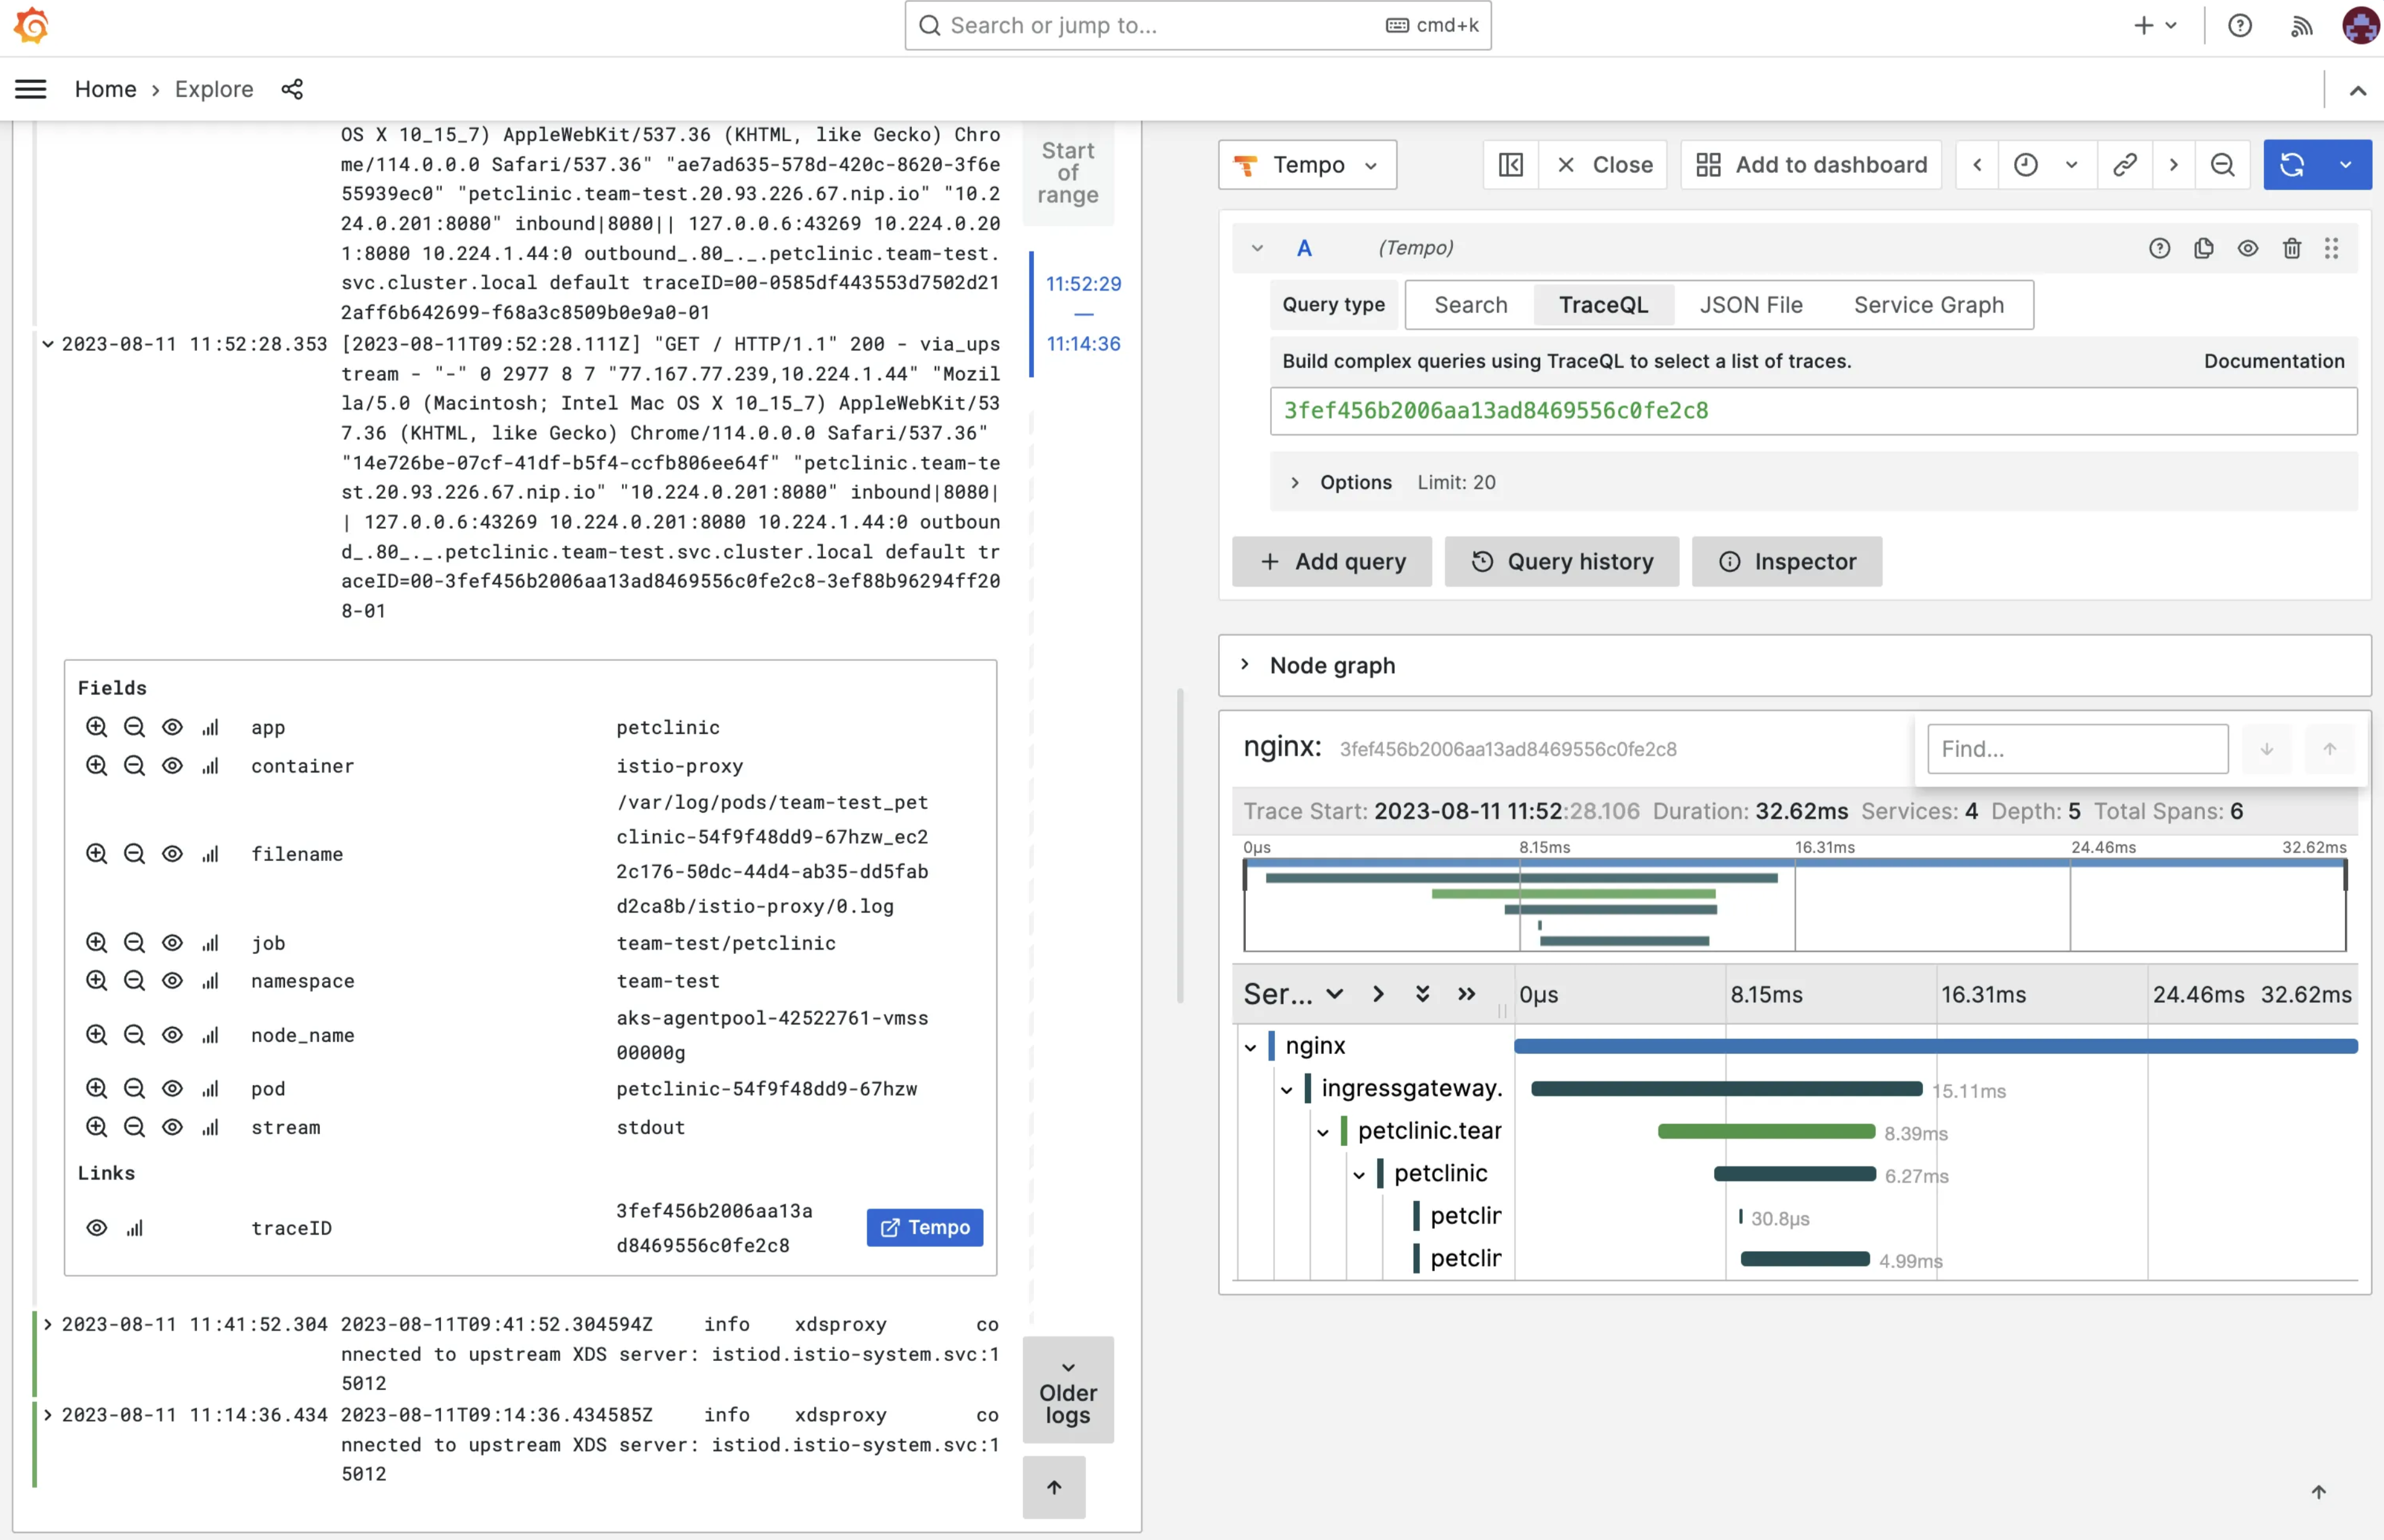
To see traces, you'll first need to find a TraceID of a trace. Go to Apps in the left menu and then click on Loki. Select the label App and select value petclinic.
Click on a log entry of a request. Note that the requests are logged by the Istio Envoy proxy. You will now see a link to the full trace in Grafana Tempo. Click on it.
If you don't see any traces, then check and see if the pod runs the
ghcr.io/open-telemetry/opentelemetry-operator/autoinstrumentation-java:1.26.0container. Sometimes the pod starts before theInstrumentationresource has been created. If this is the case, restart the Pod.
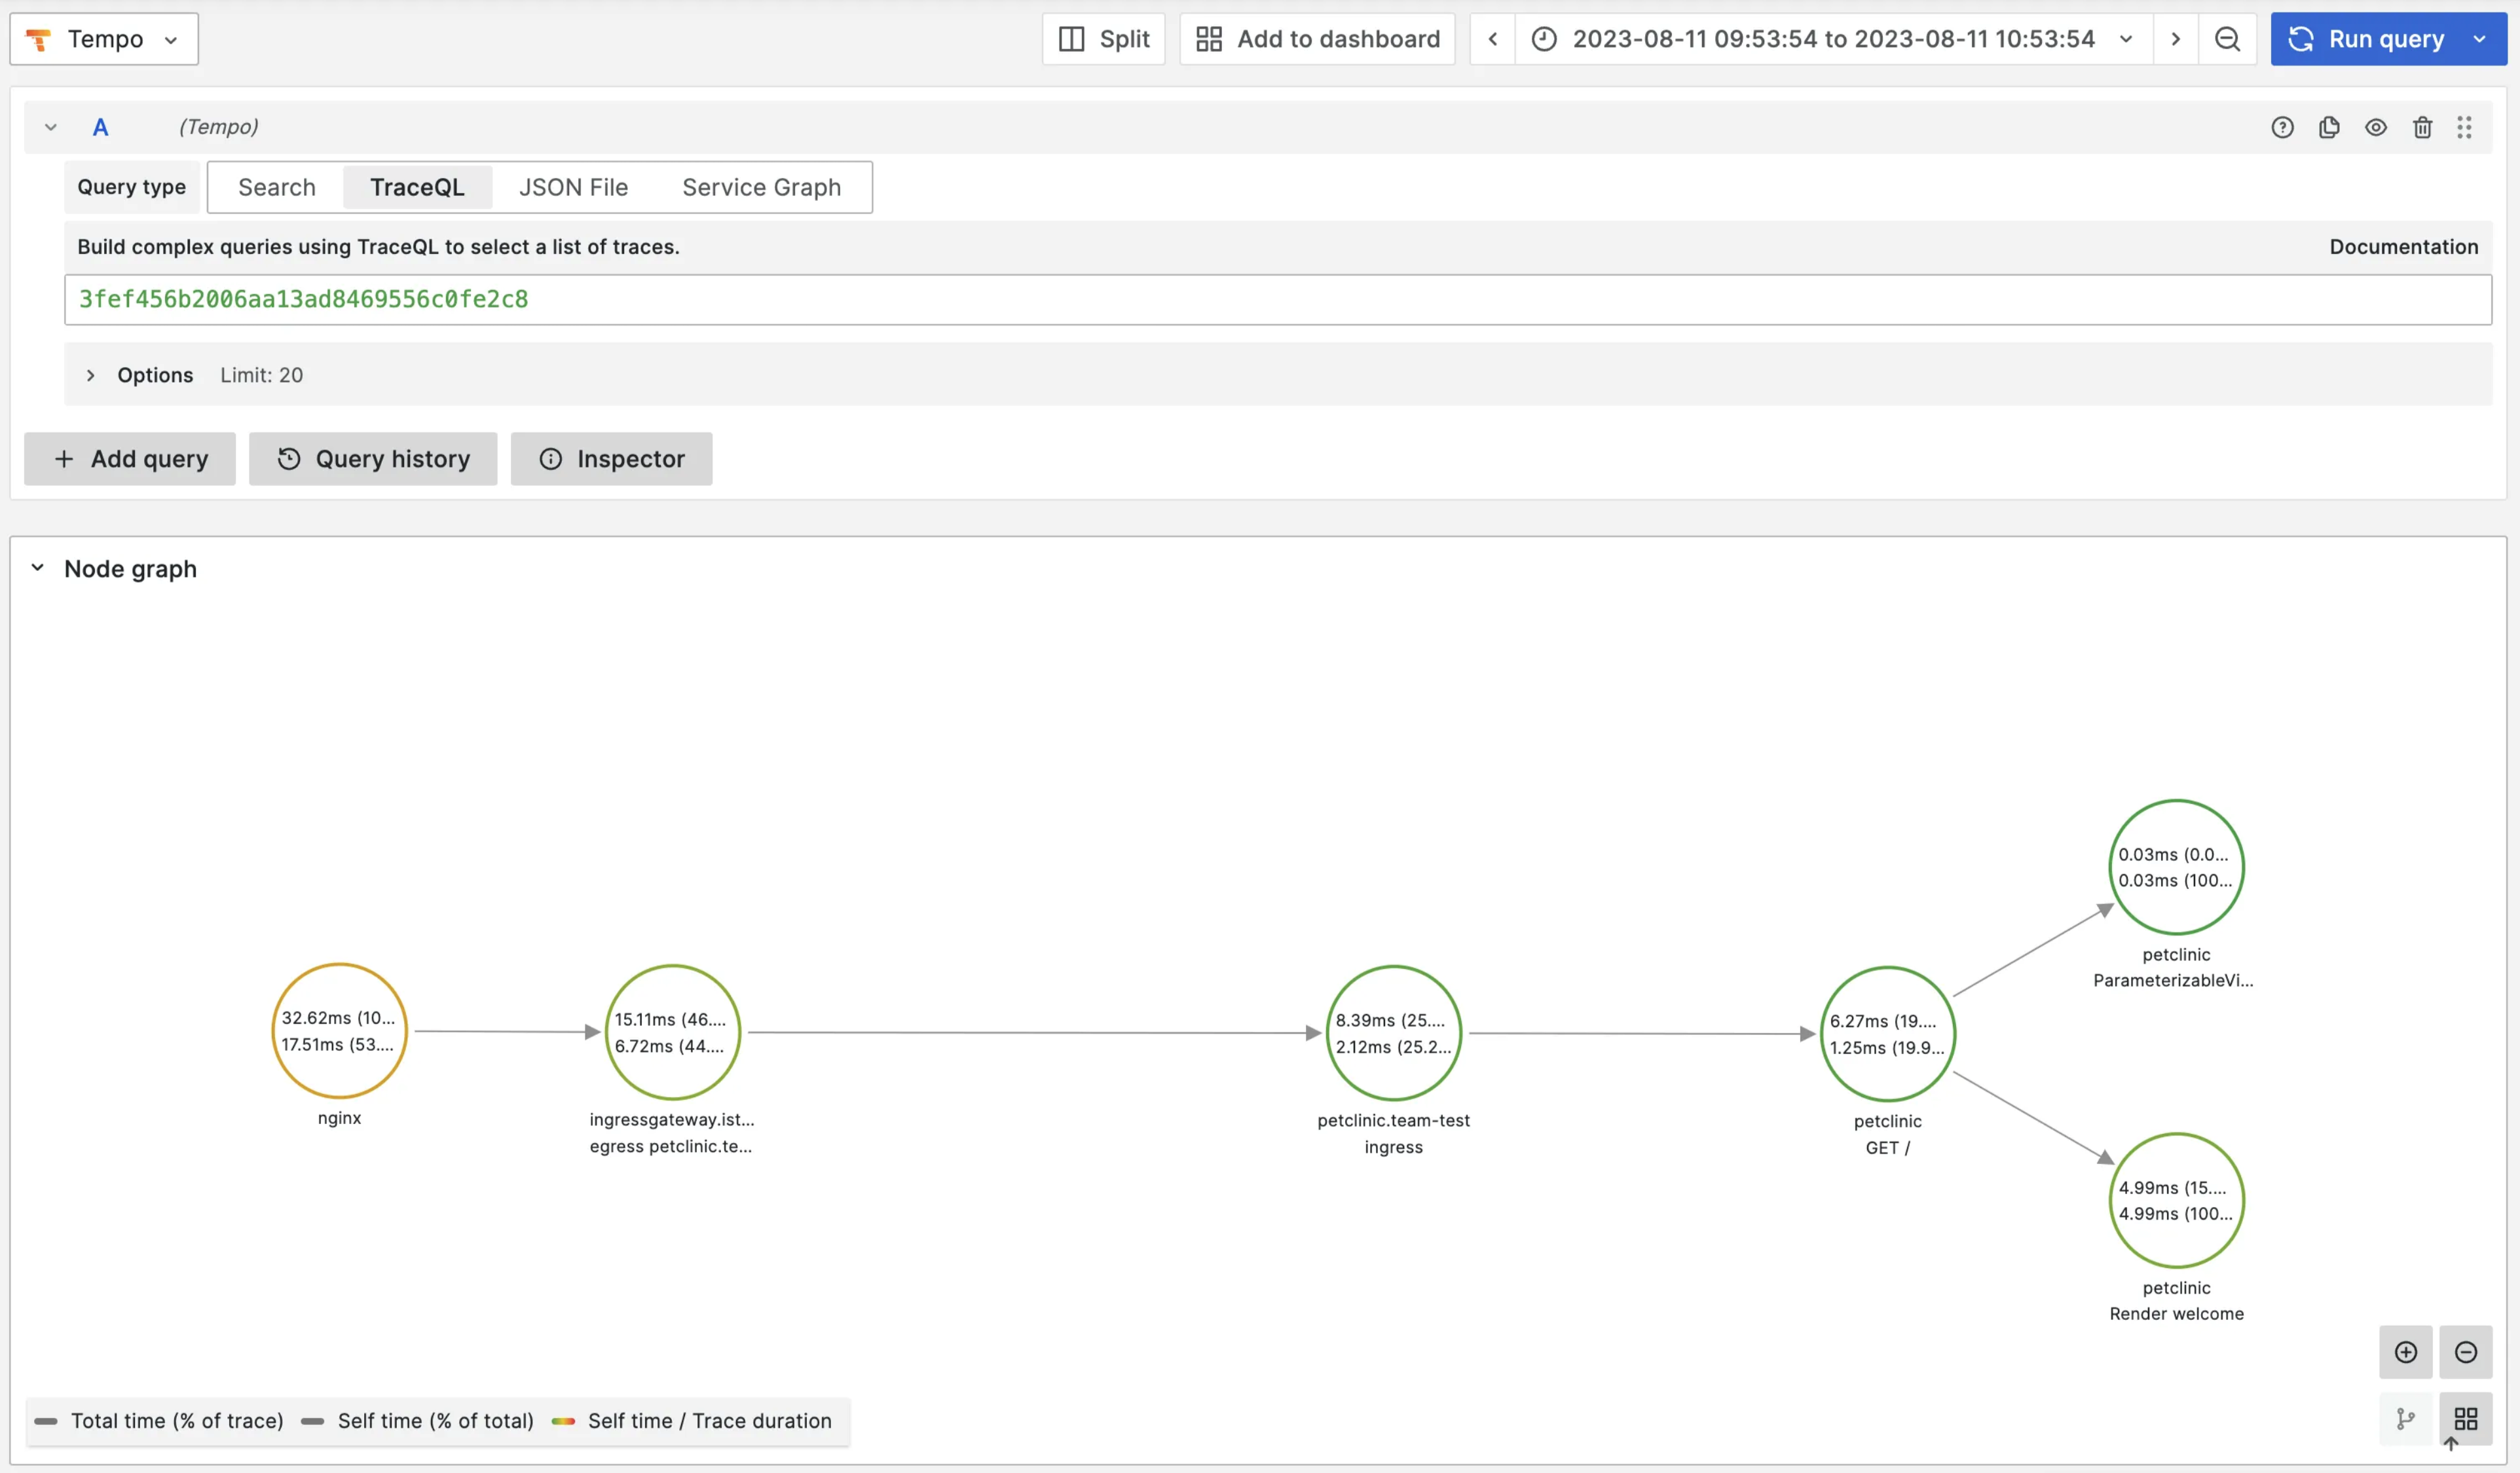
And when you click on the Node graph, you’ll see the complete flow:
Updated 5 months ago