Raw logs
The Raw Logs table uses Grafana’s logs to show all the logs selected within the time window. You can also apply an optional filter.
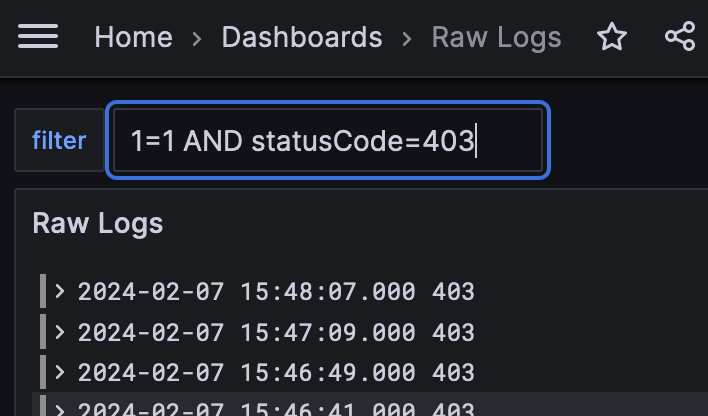
You can type the filter directly into the filter bar, or enter it in the dashboard’s URL via the var-filter query string parameter.
For example,https://grafana-us.trafficpeak.live/d/${__dashboard.uid}/raw-logs?orgId=1&var-filter=1=1%20AND%20statusCode=403
Updated 7 months ago