Akamai SIEM
This dashboard shows information distilled from the logs from Akamai’s SIEM Web Application Firewall. You can filter each query using the filter bar at the top.
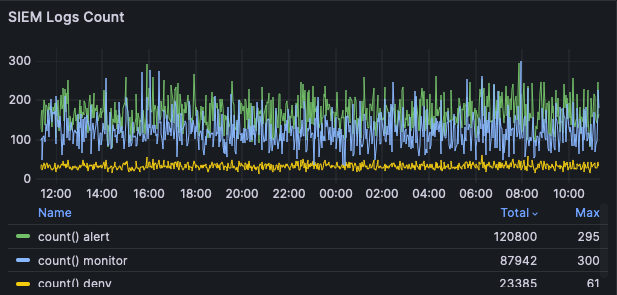
SIEM Logs Count
This table uses the arrayJoin function to count the number of occurrences of each ruleAction sent by Akamai. There can be more than one ruleAction per log line.
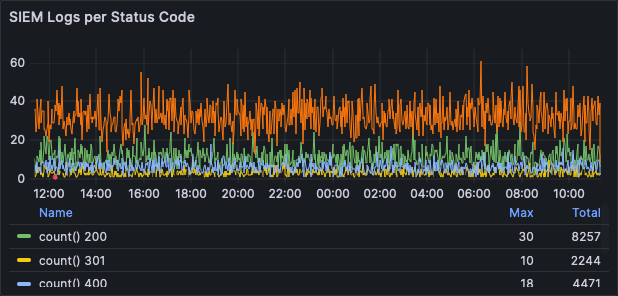
SIEM Logs per Status Code
Akamai’s status field is counted and grouped to show you the most common responses from Akamai.
Top 100 Message
This widget counts individual messages reported in Akamai’s ruleMessages field. Each log entry can have more than one rule message.
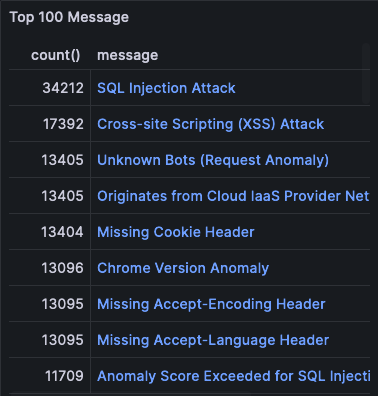
You can narrow the the entire dashboard’s query by clicking on the items in these lists. For instance, to limit the dashboard to just "SQL Injection Attack," click on it. You’ll see that string in the Rule message filter at the top of the screen.
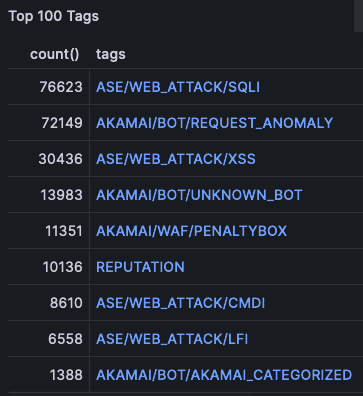
Top 100 Tags
This table shows you the most popular ruleTags within the time zone specified. Each log entry can have more than one tag.
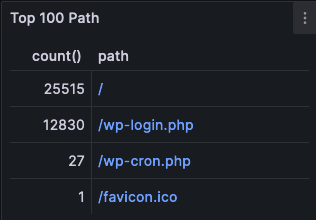
Top 100 Path
A ranking of each path from Akamai.
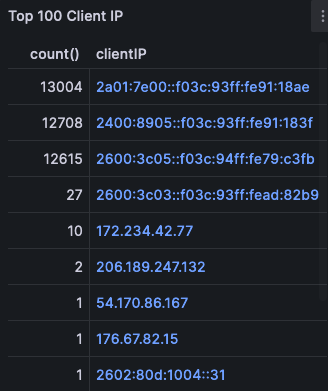
Top 100 Client IP
A ranking of the clientIP reported by Akamai for each log line.
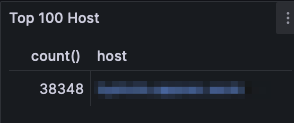
Top 100 Host
A list of the most popular hosts reported by Akamai.
Updated 7 months ago