Configure the ClickHouse driver for Grafana
TrafficPeak includes a pre-configured Grafana installation. If you want to use another instance of Grafana that’s not automatically configured to query your TrafficPeak database, follow these steps to connect it.
Add a new ClickHouse connection
You must have administrator access to your Grafana instance to connect to TrafficPeak.
-
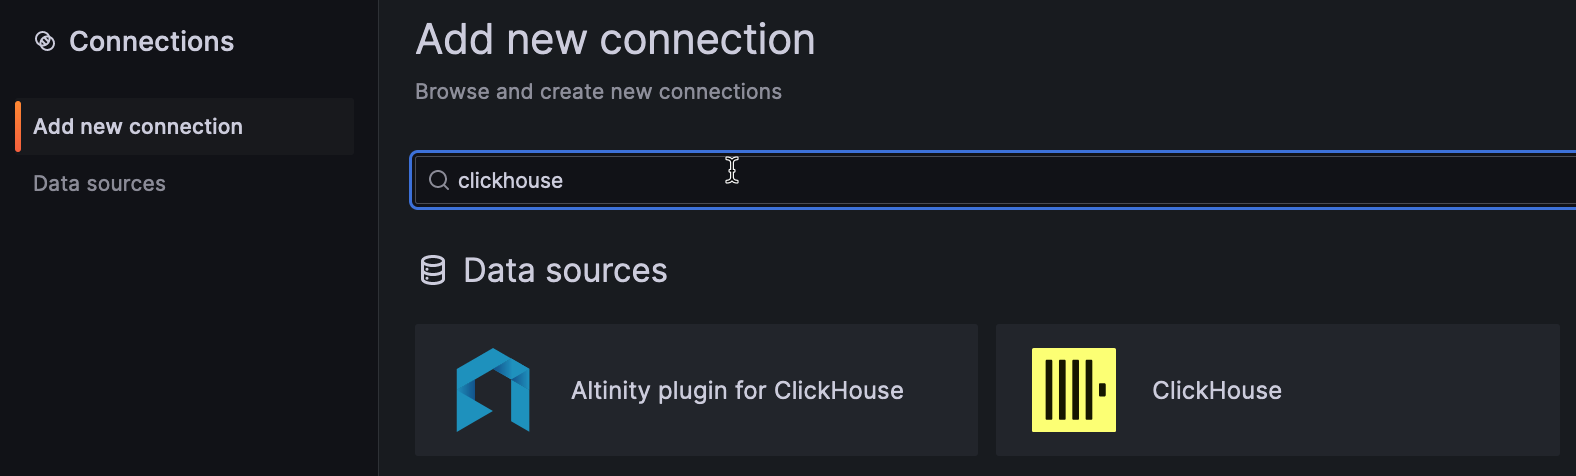
Click Connections in the left-hand menu.
-
Select Add new connection and filter for “ClickHouse.”
You will see several options, but the one you want to use is the “ClickHouse” data source with the yellow logo.
-
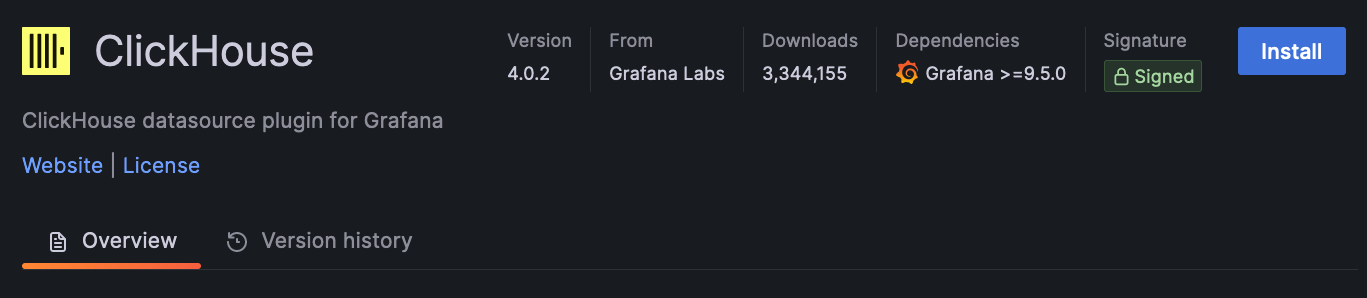
Select it, and click the Install button in the upper right-hand corner.
Configure a new data source
Configure a new data source by clicking the  button.
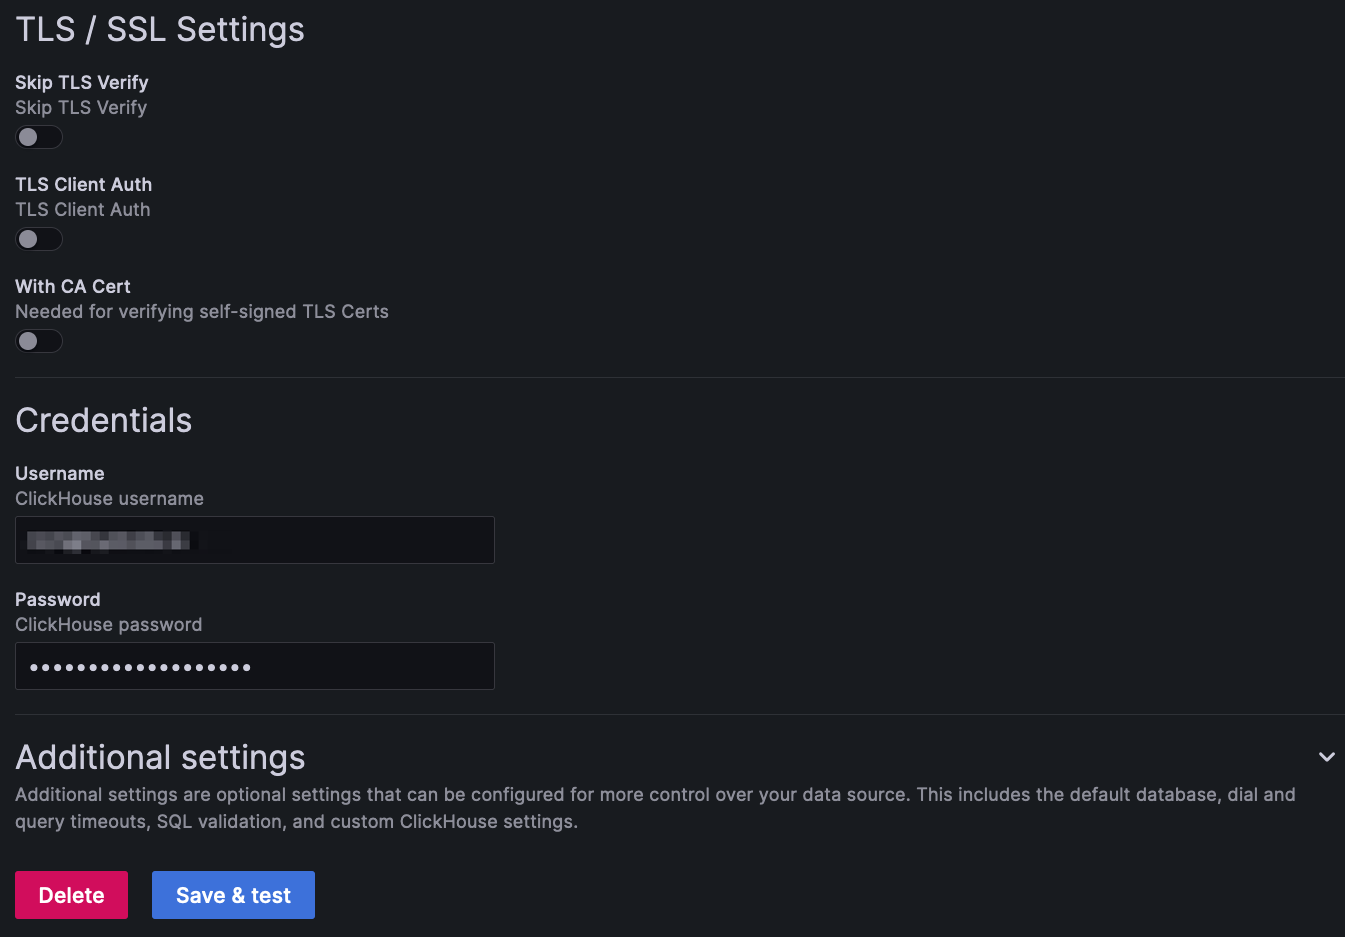
While configuring, do these things.
-
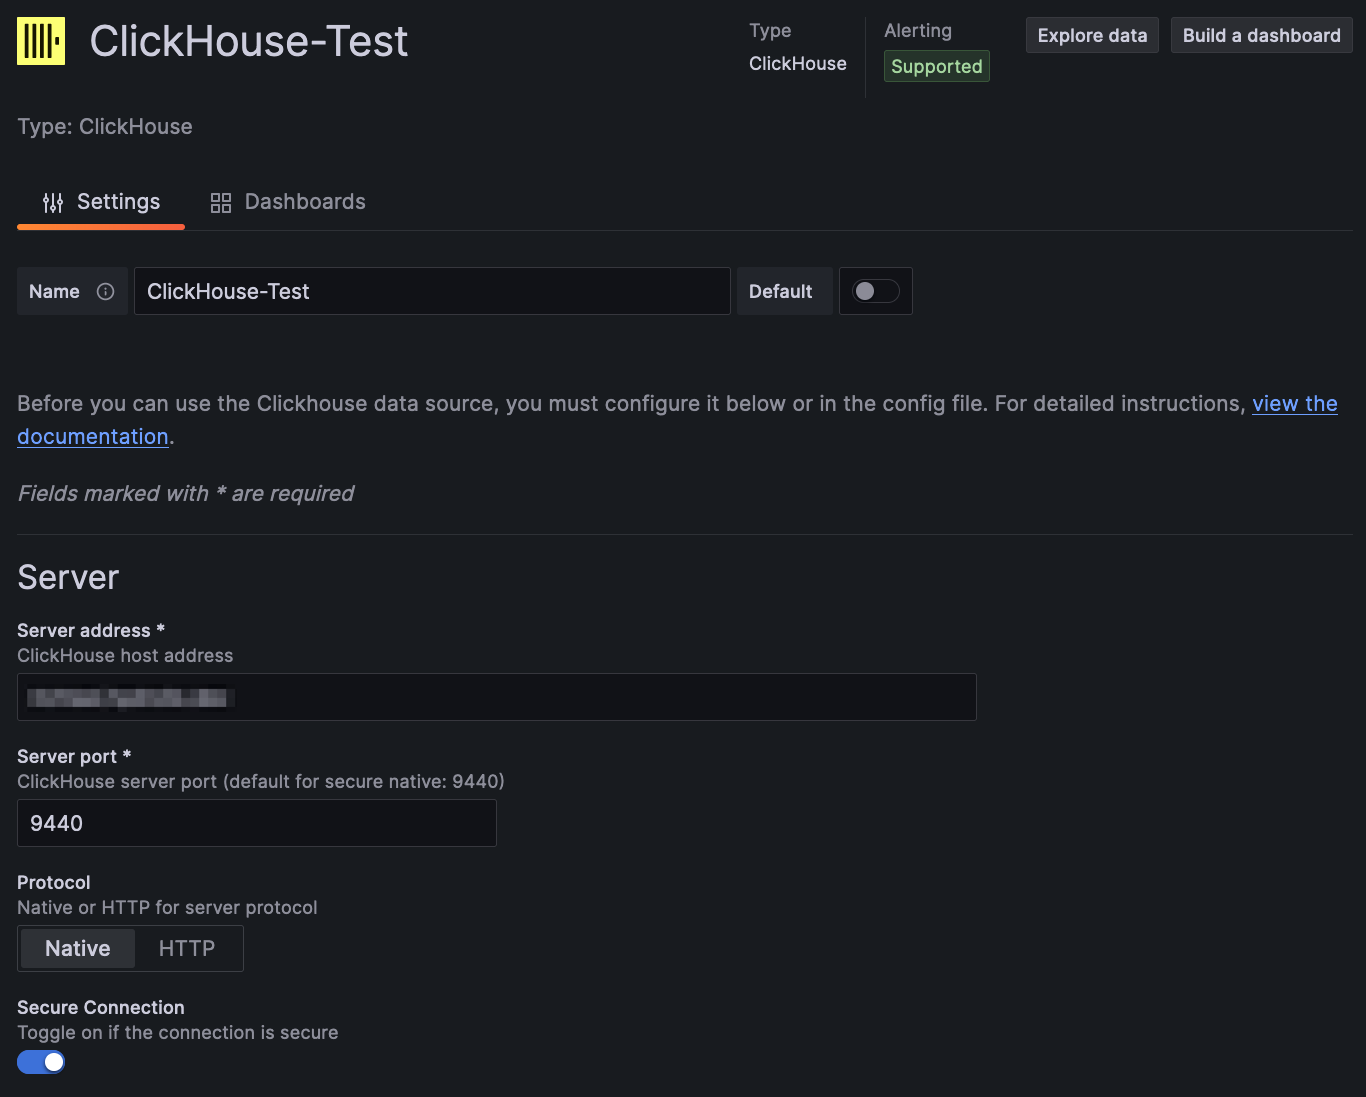
Enter a unique name for this TrafficPeak connection.
-
Enter your TrafficPeak hostname for the server address. It will follow this format:
<host>.TrafficPeak.live. If you don't have this information, reach out to your TrafficPeak service representative. If you are on a shared infrastructure, it will look like an airport code as the hostname, such asord.TrafficPeak.liveorams.TrafficPeak.live. -
Enter 9440 for server port.
-
Select the Native protocol.
-
Enable Secure Connection.
-
Enter a default database that contains the data you would like to visualize.
-
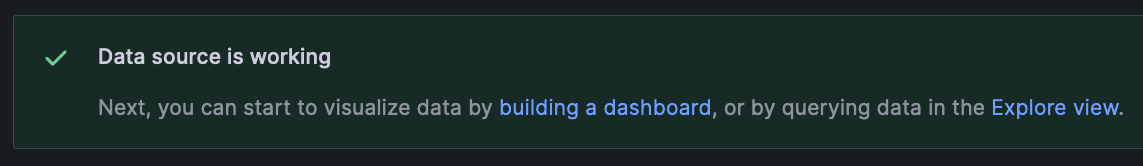
Click Save & test to verify the connection.
If you’ve configured everything correctly, you should see a "Data source is working" notification:
Updated 7 months ago