Grafana query builder
To build a new dashboard widget, start by building the SQL query that provides the data for that widget. Grafana's Query Builder will help you build that query using your TrafficPeak data for live examples.
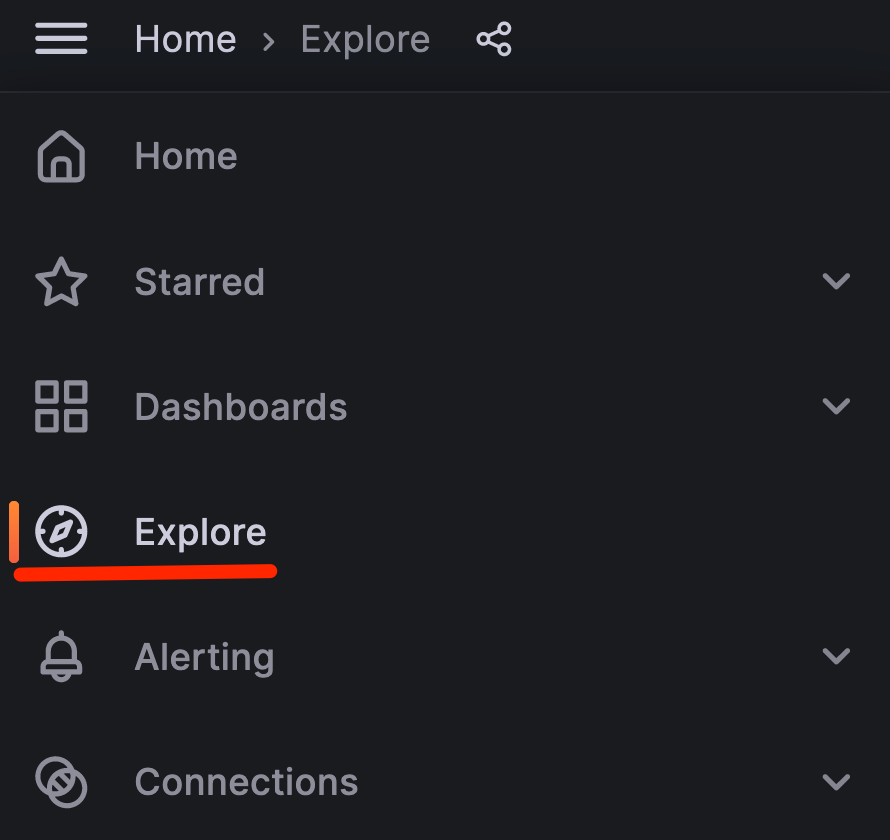
To view the Query Builder in Grafana visit the main menu and select Explore.
The Query Builder has two modes, SQL Editor and Query Builder. The Query Builder is a good way to get started with your own query. It will aid you with syntax and the timepicker placeholder variables. Later, switch to the SQL Editor to fine-tune the query.
Search for data
- In the Query Builder, pick your database and table. Notice how the time filter is already in place to work with the timepicker in the upper-right corner of the page. You can see this in the
$\_\_timeFilter(reqTimeSec)and similar variables in the query. - Periodically check the SQL Preview field to see the actual SQL the Query Builder is preparing to run.
- Start with a
count()of rows satisfying your conditions. Once you’ve found candidate rows, pull several timestamps to discover the duration of the behavior you’re seeking. - Finally, narrow the next query down to just that time range and pull all the fields to help you spot corresponding anomalies.
Debug queries
When debugging queries, errors in the query will appear underneath the SQL preview. There are three types of errors: Grafana, ClickHouse driver, and SQL/database errors.
- Use the query inspector to show what the final version of the query looked like before it was run. It will show you how the query was interpreted to help you find bugs.
You will find the query inspector behind the Inspector button below the Query Builder.
- If you’re seeing query timeouts, they can be adjusted on the Data source. In the main menu, select Connections, then click Data sources. Find the ClickHouse data source that you’re currently using and adjust your query timeout setting.