Customize dashboards
TrafficPeak creates dashboards to provide you with essential information. You can also add your own new dashboards and widgets.
Dashboards are stored in the Grafana organization of your TrafficPeak Grafana installations. For customization that requires modification of the Grafana server’s configuration, create your own self-hosted Grafana instance, or use Grafana Cloud.
List dashboards
Grafana displays the most commonly used dashboards on the home page of the interface.
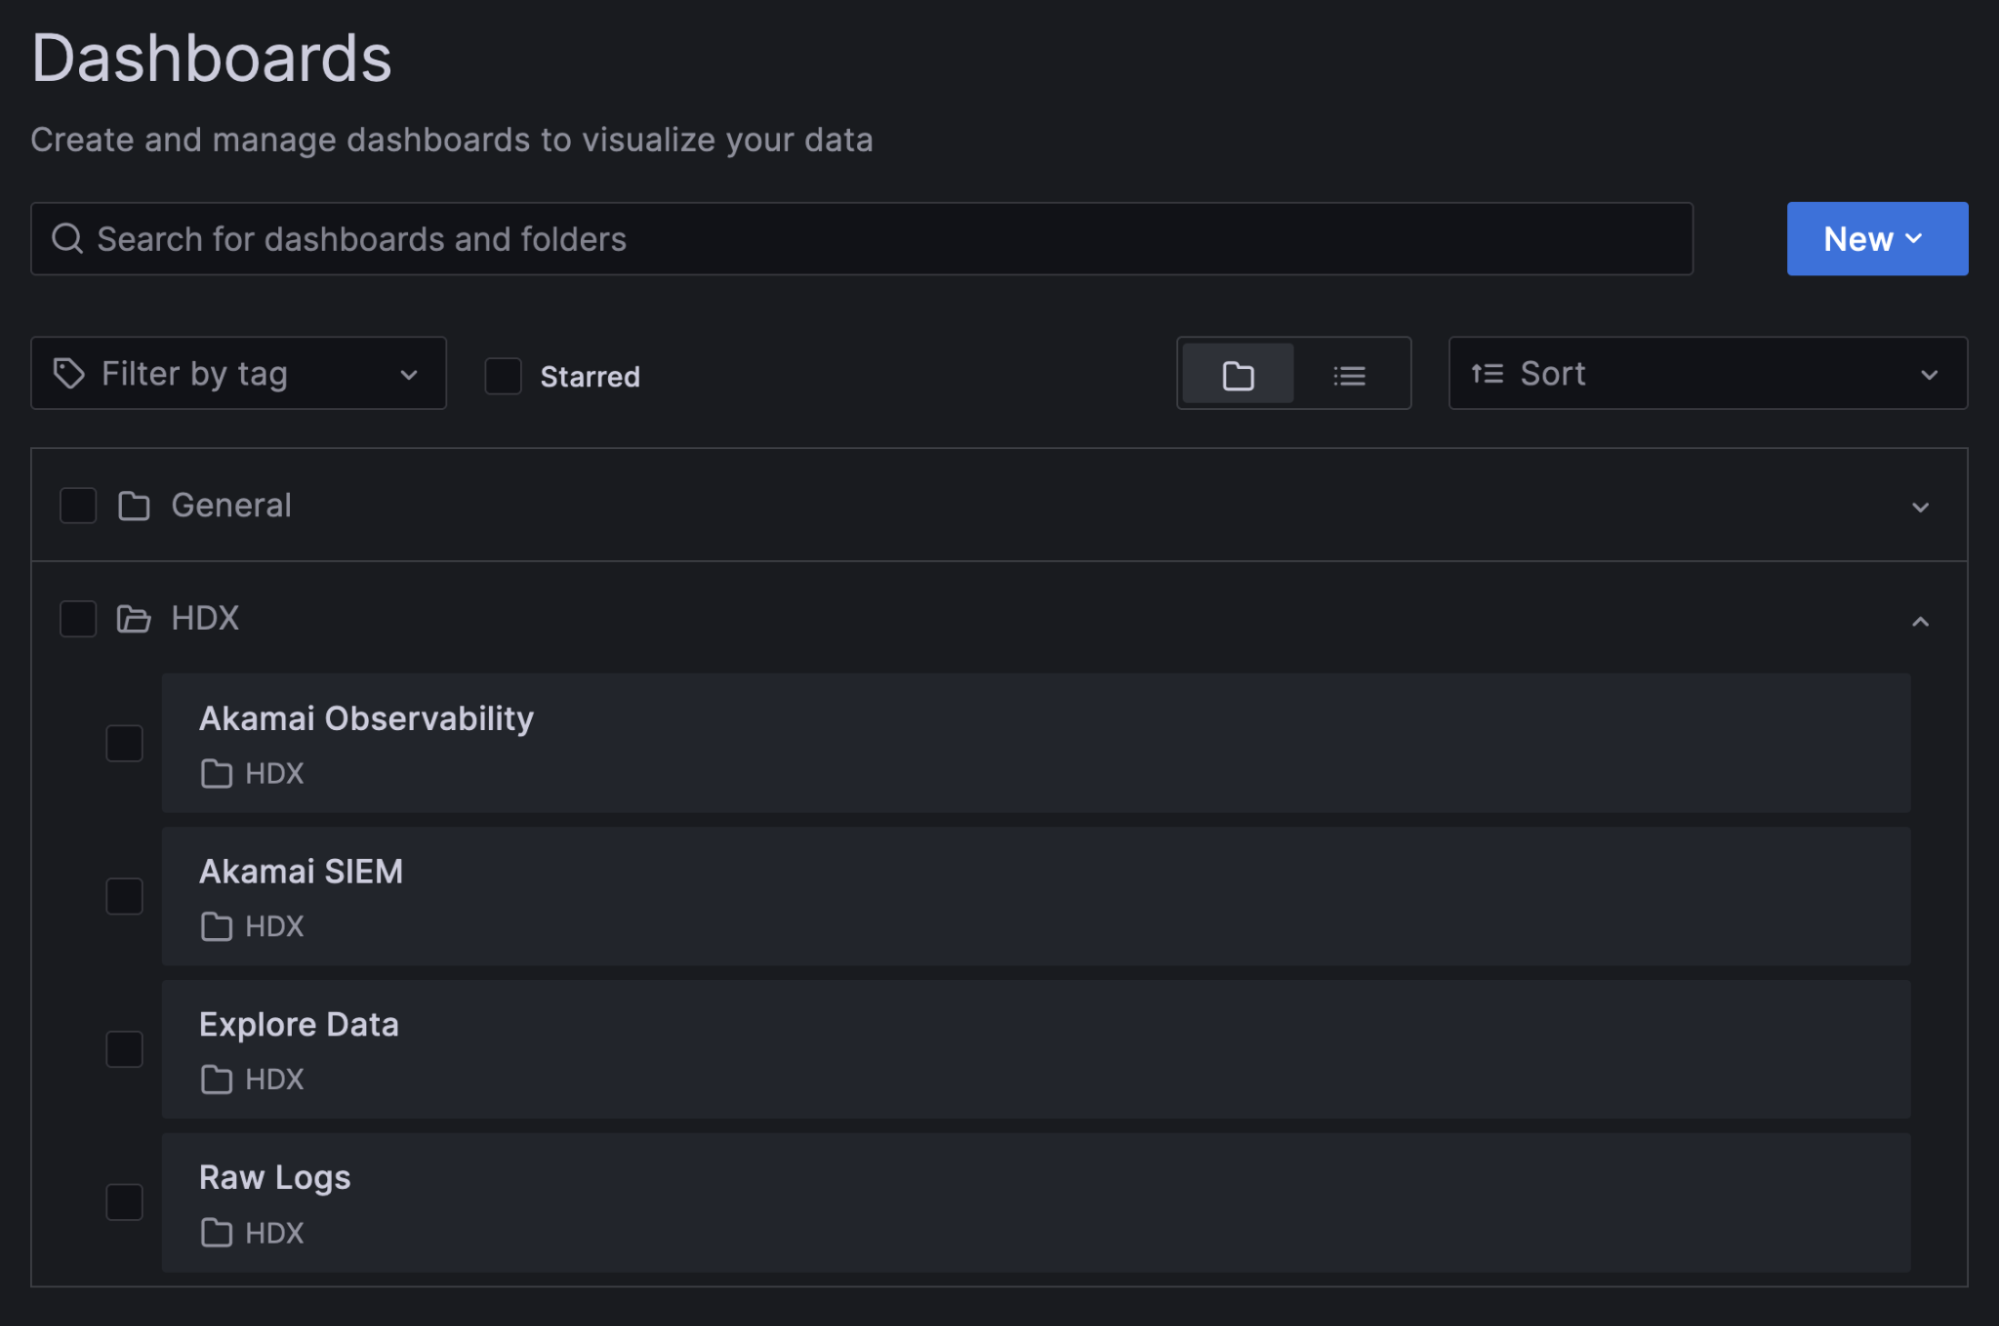
Dashboard folder layout
From this view, you can create, import, and organize dashboards into folders.
- Use the search bar to find existing dashboards and folders
- Click New to create new folders and dashboards, or import dashboards
- Select a folder to move or delete it
Pre-made dashboards are automatically updated with new versions as they become available.
Copy dashboards
Grafana makes it simple to create a copy of any default dashboard for customization.
Why should I copy the default dashboards?The default dashboards are occasionally updated with the latest widgets and charts. It’s a good practice to copy these dashboards and modify the copied versions rather than modifying the default dashboards directly. This will avoid having your changes being overwritten by new versions of dashboards that are written to the “TrafficPeak” folder.
-
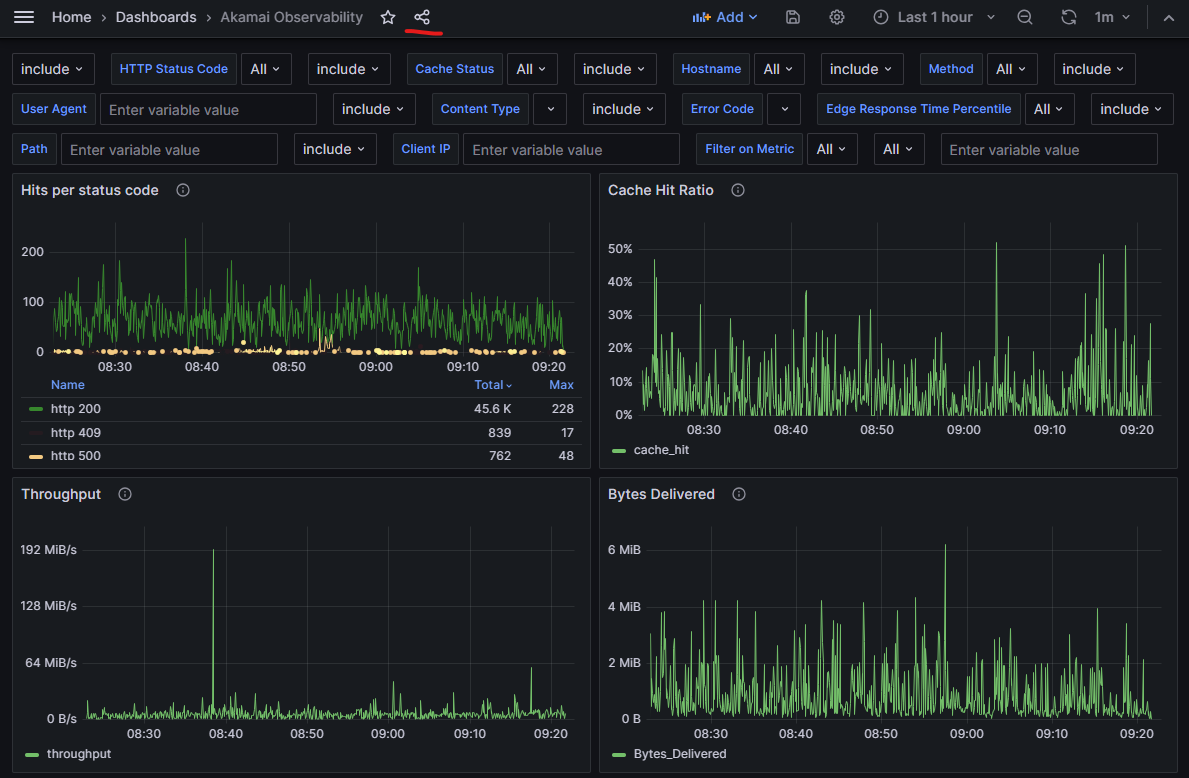
View the dashboard you wish to copy.
From this view, you can create, import, and organize dashboards into folders.-
Use the search bar to find existing dashboards and folders
-
Click New to create new folders and dashboards, or import dashboards
-
Select a folder to move or delete it
-
Use the search bar to find existing dashboards and folders
-
Click New to create new folders and dashboards, or import dashboards
-
Select a folder to move or delete it
-
Use the search bar to find existing dashboards and folders
-
Click New to create new folders and dashboards, or import dashboards
-
Select a folder to move or delete it
-
Use the search bar to find existing dashboards and folders
-
Click New to create new folders and dashboards, or import dashboards
-
Select a folder to move or delete it
-
-
Click the Share link.
-
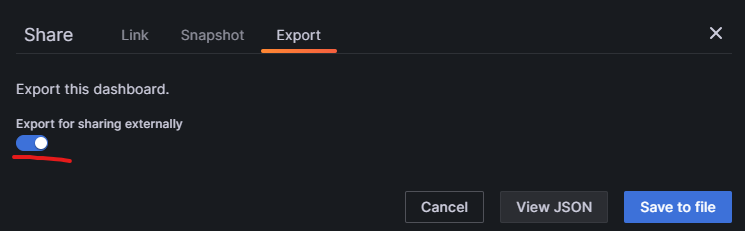
Select the Export option at the top and make sure to select Export for sharing externally.
-
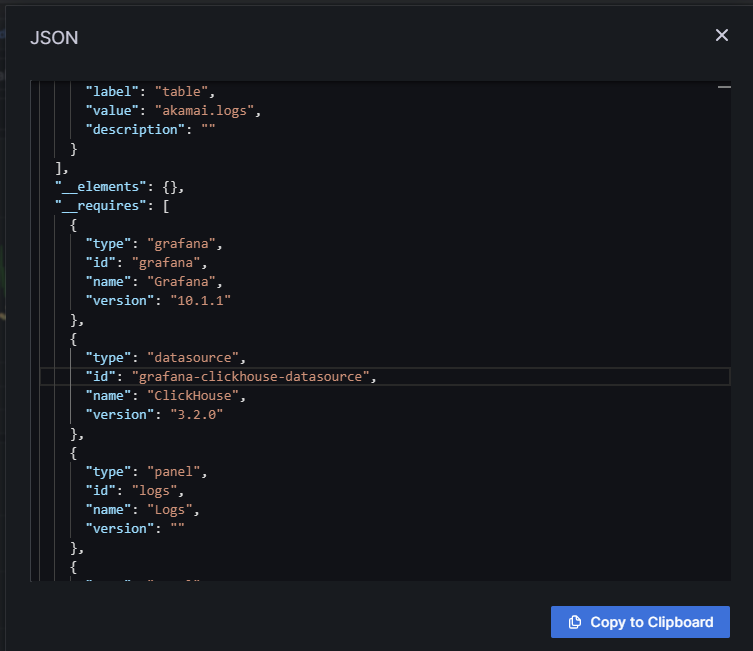
Select View JSON and then Copy to Clipboard.
-
Go back to your Dashboards menu, click New and then Import.
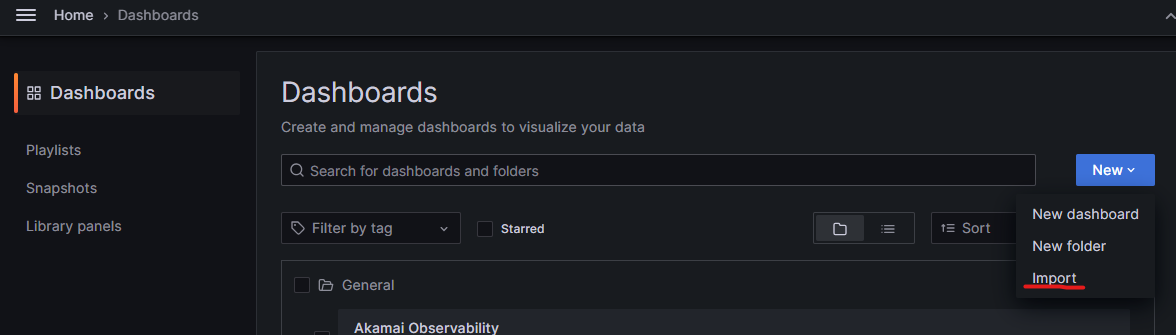
-
Paste your dashboard into the Import via panel json text box and click Load.
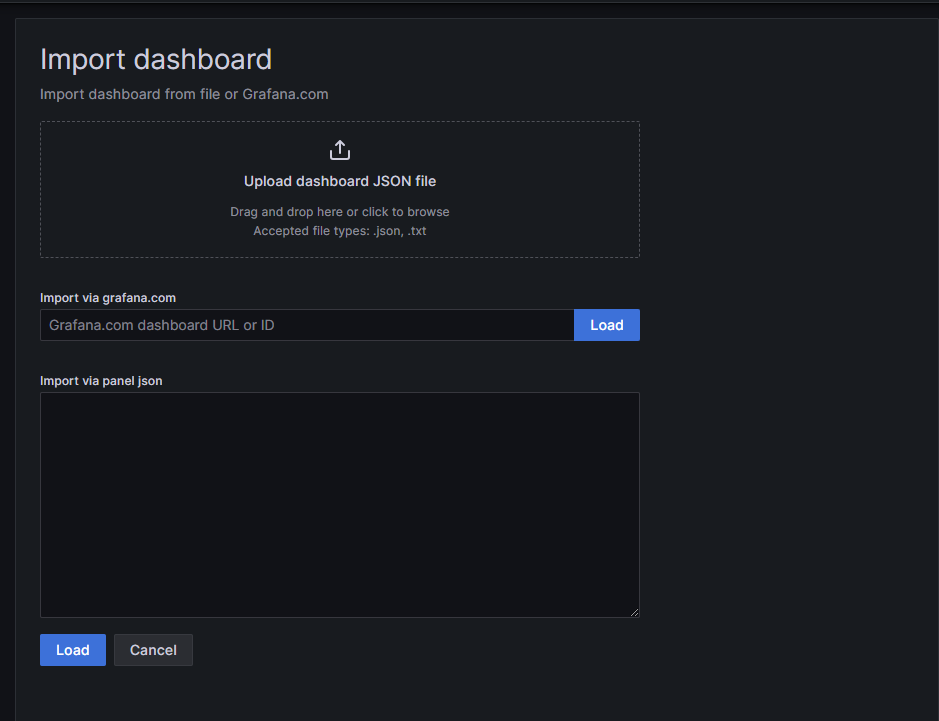
-
Review the resulting dashboard import screen.
If you are importing into the same organization, you may see the warnings about the dashboard already existing. If you import now, you will overwrite the existing dashboard, which isn’t what you want.
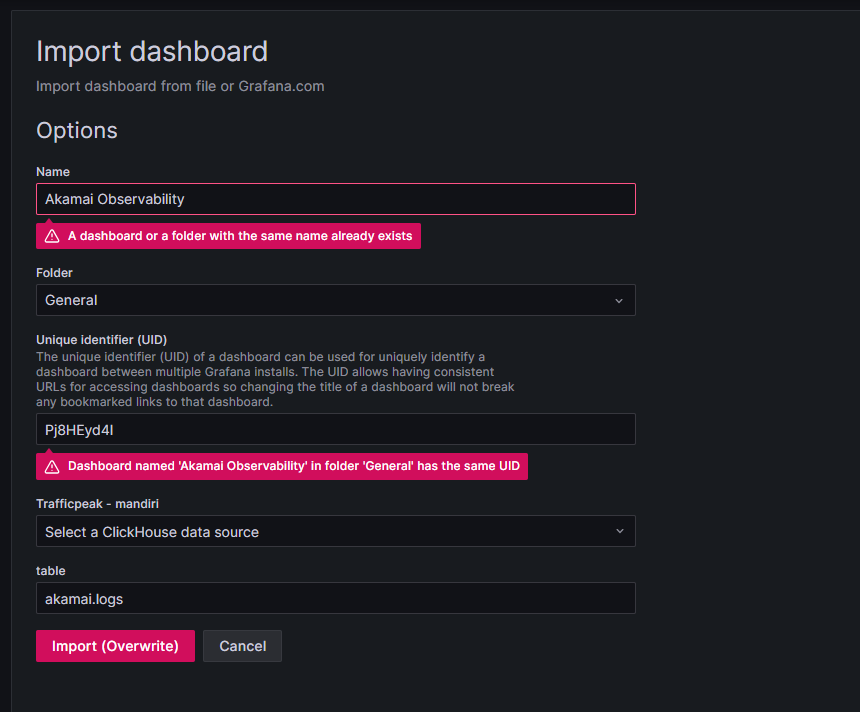
Instead, before you click Import, change the name, select the folder you want to put it in and modify the UID. Also, make sure you select a ClickHouse DataSource as otherwise the Grafana dashboard won’t know where to collect its data. The table can stay as it is.
- Finally, click Import.
You should now have a personalized copy of the dashboard that you can modify to suit your needs.