Example dashboard query
You can write queries to make customized widgets on dashboards.
This guide examines an existing dashboard query. These queries use the Grafana macros available from the ClickHouse Driver, documented in Grafana ClickHouse Datasource.
Edit a dashboard widget
To edit a widget in your dashboard, use the keyboard shortcut or More actions menu.
Use the keyboard shortcut
- Select the widget and press E to edit the widget
Use the menu
- Click
More actions on the widget and select Edit
About this example
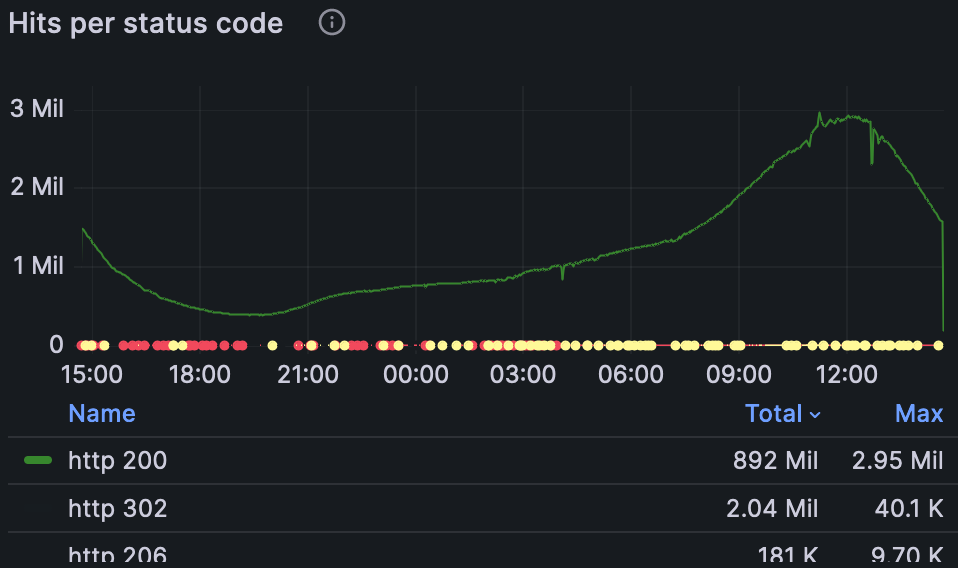
This example is from the Hits per status code widget in the Akamai Observability dashboard. It produces a widget that looks like this.
View and edit the Hits per status code widget
Select the Hits per status code widget and edit it.
Query details
SELECT toString(statusCode) as HTTP_Status_Code, $__timeInterval(reqTimeSec) as time, count(*) as http
This query selects three columns:
- HTTP_Status_Code: HTTP response status code.
- Time: Start of each time bucket (auto-calculated by Grafana). The macro
$\_\_timeInterval(reqTimeSec)expands to an expression such astoStartOfInterval(toDateTime(column),INTERVAL 20 SECOND).
For details, see Working with Time Series Data in ClickHouse. - Count: Number of requests.
Table variables
FROM ${table}
This ${table} variable comes from the dashboard’s settings. To see these and other variables, click the  in the upper right corner of the dashboard, then click Variables on the left-hand side of the page.
WHERE clause
The WHERE clause applies the selected time range and dashboard filters.
WHERE $__timeFilter(reqTimeSec)
The $\_\_timeFilter macro expands to the time window selected in the UI. For example:
time >= '1480001790' AND time <= '1482576232'
These conditionals make the dashboard filter bar apply to this query.
__conditionalAll includes a predicate only when the variable has a value; otherwise it omits it.
| Variable | Conditional macro |
|---|---|
| statusCode | AND $__conditionalAll(statusCode ${AND_statusCode} (${statusCode:sqlstring}), $statusCode) |
| reqHost | AND $__conditionalAll(reqHost ${AND_reqHost} (${reqHost:sqlstring}), $reqHost) |
| cacheStatus | AND $__conditionalAll(cacheStatus ${AND_cacheStatus} (${cacheStatus:sqlstring}), $cacheStatus) |
| reqMethod | AND $__conditionalAll(reqMethod ${AND_reqMethod} (${reqMethod:sqlstring}), $reqMethod) |
| rspContentType | AND $__conditionalAll(rspContentType ${AND_rspContentType} (${rspContentType:sqlstring}), $rspContentType) |
| errorCode | AND $__conditionalAll(errorCode ${AND_errorCode} (${errorCode:sqlstring}), $errorCode) |
| transferTimeMSec | AND $__conditionalAll(transferTimeMSec >= ${transferTimeMSec_percentile}, $transferTimeMSec_percentile) |
| metric | AND $__conditionalAll(${metric_name} ${metric_filter} ${metric_value}, $metric_filter) |
| reqPath | AND $__conditionalAll(reqPath ${AND_reqPath} (${reqPath:sqlstring}), $reqPath) |
| cliIP | AND $__conditionalAll(cliIP ${AND_cliIP} (${cliIP:sqlstring}), $cliIP) |
| UA | AND $__conditionalAll(UA ${AND_UA} (${UA:sqlstring}), $UA) |
The $__conditionalAll() macro expands based on what is selected in the filter bar.
If nothing is selected, it expands to the placeholder 1=1, which the query engine ignores when it runs.
The first example looks like this:
AND $__conditionalAll(statusCode ${AND_statusCode} (${statusCode:sqlstring}), $statusCode)
The ${AND_statusCode} value comes from the Include/Exclude dropdown in the filter bar.
Set variables for a widget
- From the dashboard, click Dashboard settings from the top nav.
- Select Variables from the left nav.
- Edit the variable. For example,
$statusCode. - In the variable editor, find the Include/Exclude option.
This controls whether the macro expands toINorNOT IN.
It expands to IN or NOT IN in this query, based on the rules set in the dashboard’s Variables configuration.
The (${statusCode:sqlstring}) variable expands according to the dashboard configuration. It lists the possible status codes, such as 200, 201, 202, and others.
The $statusCode variable represents what the user has selected in the UI, if anything.
Other conditionals in this list include SQL statements that populate the filter bar dynamically. For example, the reqHost conditional includes this query:
`SELECT reqHost FROM ${table} WHERE $__timeFilter(reqTimeSec) GROUP BY reqHost ORDER BY COUNT() DESC LIMIT 50`These queries run each time the dashboard page is refreshed. Keep them efficient to reduce load times.
The next part of the query groups and orders the data for the time series chart.
`GROUP BY HTTP_Status_Code, time ORDER BY time`The query ends with a SETTINGS section, where you can specify database settings such as hdx_query_max_execution_time (in seconds) and hdx_query_max_memory_usage (in bytes per query) if needed.
`SETTINGS hdx_query_max_execution_time=60, hdx_query_admin_comment='akamai - statuscode - ${__user.login}'Updated 5 months ago