Explore data
The Explore Data dashboard provides a quick way to understand the database schema for your DataStream 2 stream, narrow your data down to just what you want to see, then drill-down into the individual rows without writing SQL.
To use it, start with the Total Countfield in the upper left corner and then work in a counter-clockwise direction.
Total Count
This field has two purposes. It shows the total number of rows the dashboard is currently set to inspect within the currently selected timeframe. As you apply filters to data, this number will become smaller.
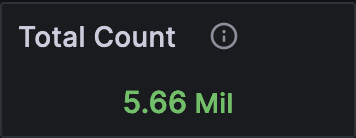
When this number is below 1,000, it becomes a shortcut to a new view that allows you to inspect the data row-by-row.
Current Filter
Just to the right of theTotal Count field, the current filter is displayed.
Keep an eye on this field as you work to understand just how you’re telling the underlying SQL query to focus on the data you need.
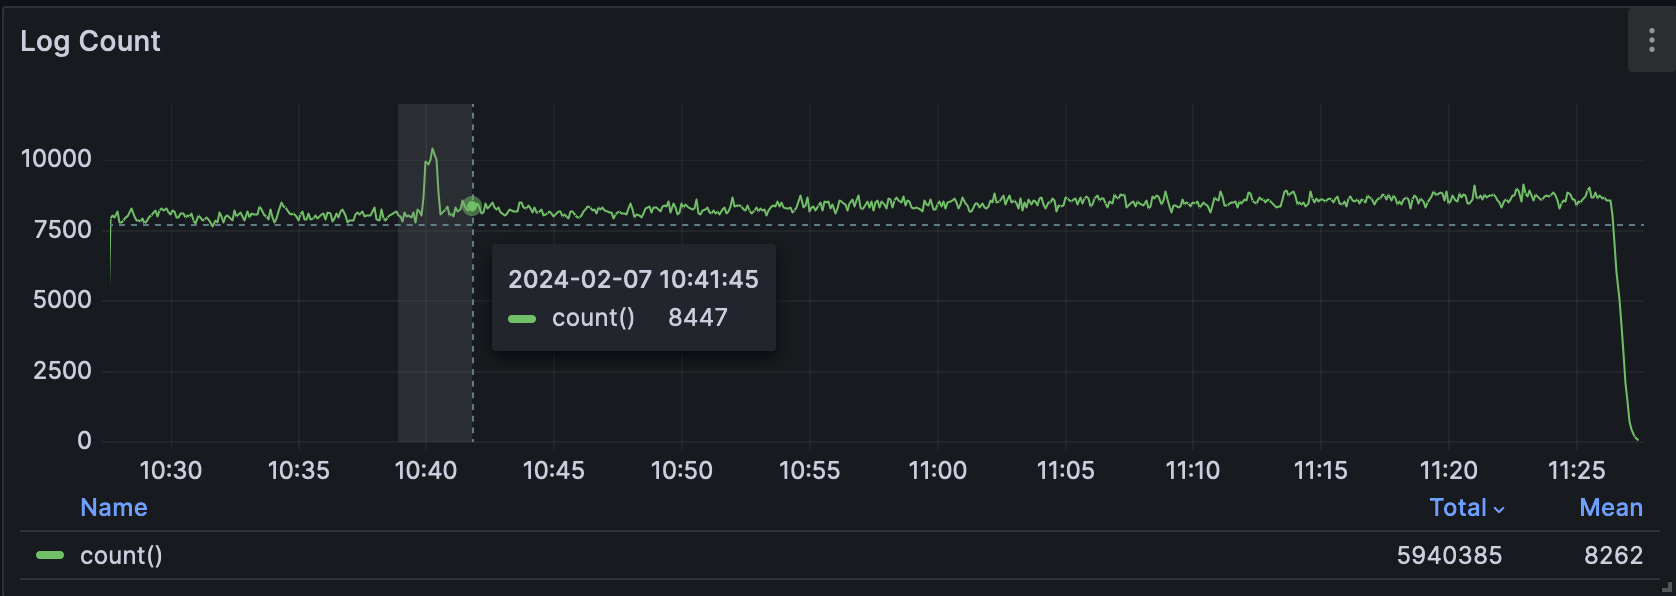
Log Count
A standard time series view of your current query. You can view anomalies graphically and you can also set the timeframe by dragging your mouse over portions of the data.
Schema → Table
The Table widget in the Schema section shows you the fields available for filtering. Click one of the entries to display a preview of the most popular values for that field.
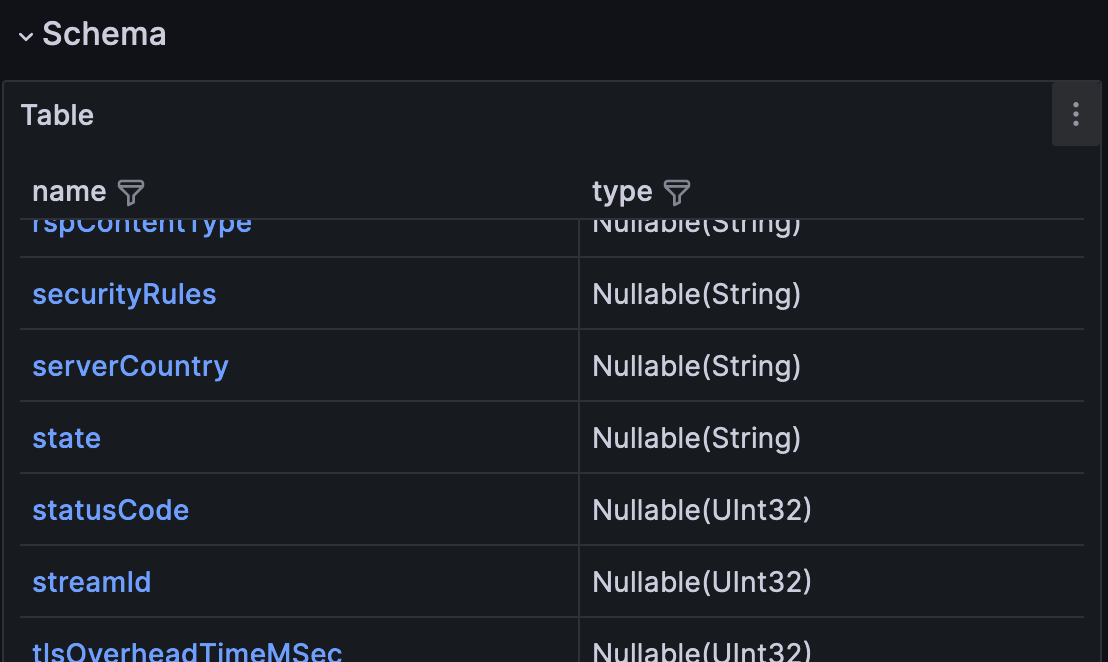
Under the hood, each name in this table contains a link to this dashboard with a var-sql parameter set to what was clicked. This sets the dashboard’s sql variable, allowing the next widget to display the correct field. To see how this is configured, edit the Schema widget and look for the Override 1 in the options table on the right.
Schema → View Top 100 Value
Suppose you clicked the statusCode field in the previous screenshot. The "Top 100 Value" table would then appear to reflect that field.
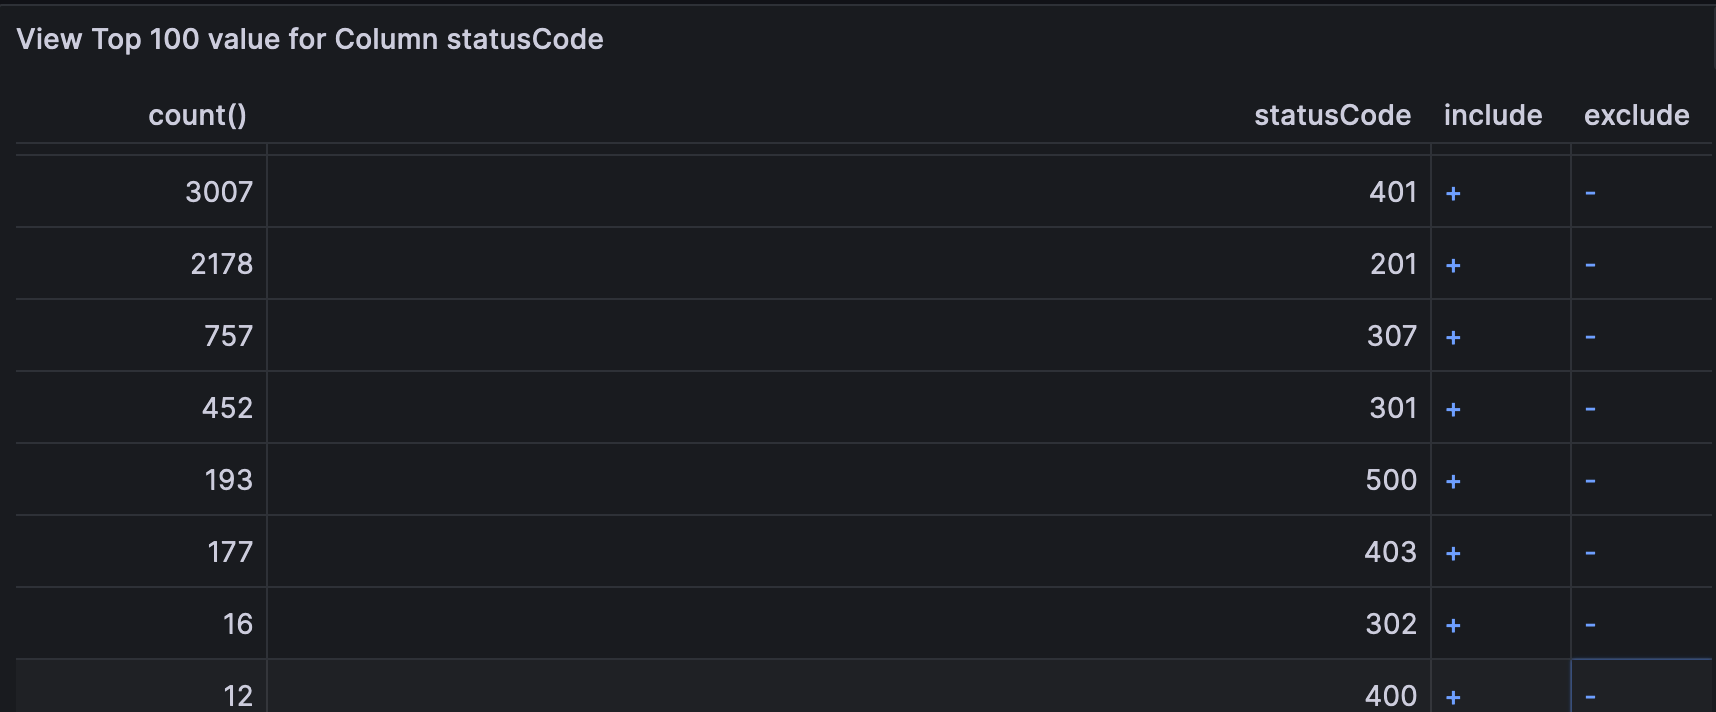
Click the + or - links to include or exclude the value of this field in your results. At this point, you can narrow your result further by selecting other field names, excluding and including values.
As you work, you will see the Total Count field get smaller. The Log Count graph will show just the rows in which you’re interested. This may be enough to help you understand your data.
However, once you have reached a manageable number of rows, the Total Count field will turn into a View Logs link.
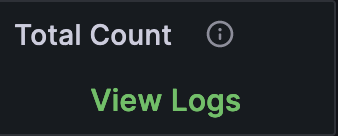
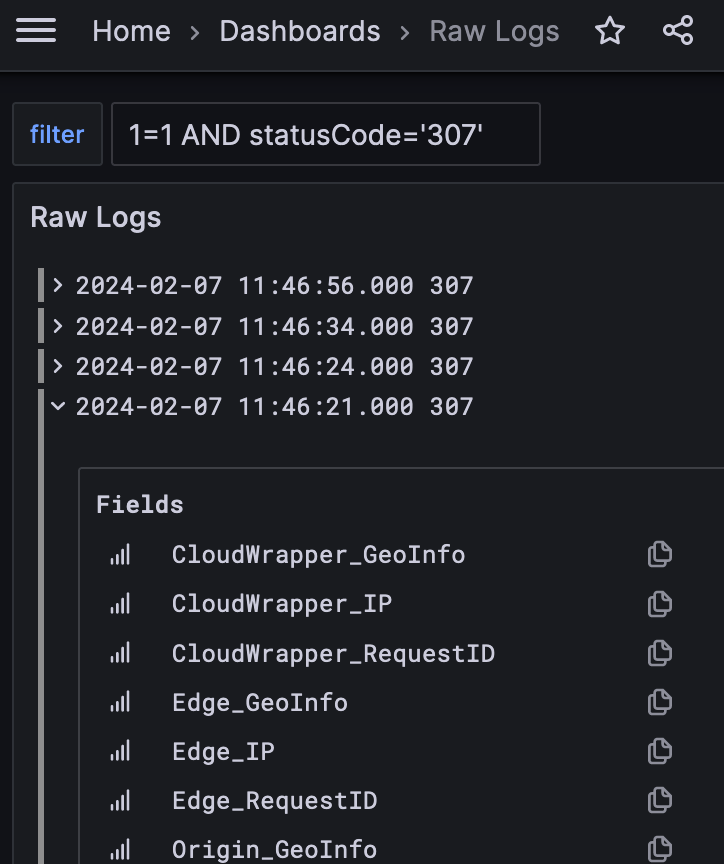
When you select View Logs it drops you straight into the Raw Logs dashboard for log-by-log inspection.
Updated 7 months ago