Navigate Web Security Analytics
With Web Security Analytics you can check how the protections you’ve set actually work, and, based on your findings, improve your security configurations. The dashboard offers details on attack data, clearly identifying and correlating different attack types, their categories, and specific rules that were triggered. You can use the data found here to:
- Better understand all of your attack traffic across multiple attack types.
- See the details of specific attack traffic that you want to analyze.
- Analyze for false positives so that you can adjust your security protections.
- Investigate which malicious sources are targeting your applications.
- Spot early-stage attacks, probing activity, and emerging anomalies.
Read on to learn how to set the dimensions, filters, and dates to get the data you need. Next, review the activity logged by your security products and see the alarm notifications.
Set report scope
Before reviewing Web Security Analytics, define the scope of the report to control which data is included in the results:
-
From the Control Center menu, click Security > Security analytics > Security Center.
If you're already in Security Center, in the left menu, click Analysis > Web Security Analytics. -
In the Security Center menu bar, modify the general settings for the view.
-
Select a security configuration to view analytics for requests evaluated by that configuration. To focus on a specific one, click the current configuration name and choose the one you want to examine from the drop-down menu. The dashboard then updates to show metrics and trends for that selection only.
If your account includes App & API Protector Hybrid, you can switch the toggle between edge and hybrid security configurations.
-

- Set a time period within the last 30 days. Click the date field and select the duration or dates you want to see. The time zone is automatically applied from your Control Center profile. Learn more about data retention and query limits
- Use live mode to monitor ongoing events or mitigation activities in real time. This feature is particularly valuable during active security incidents. For example, when your environment is under attack, live mode enables you to monitor attack volume and its behavior as it evolves. It also lets you verify if your security controls are taking effect and assess if any additional action is required. Learn more
-
Web Security Analytics displays data in views which define how information is grouped and displayed.
The first time you open Web Security Analytics, the Statistics view is displayed. If you set a different view as default, that view is shown automatically when you return.
Use the menu to switch between available views:
-
Statistics view. That’s the starting point for your analysis. Use this view to create filters and drill down into the type of traffic or attack you want to analyze. It allows you to identify trends, spikes, or anomalies. Learn more
-
Samples view. After initial analysis in the Statistics view, switch to the Samples view to see the actual requests that make up the filtered category or dimension of requests. The Samples view displays individual requests along with all request data and the rules they triggered, including contributing rules outside the current Statistics view filters or dimensions.
For example, if you notice a spike in SQL injection attacks in your Statistics view, you can narrow the time range to isolate the spike. Then, you switch to the Samples view to inspect individual requests that make up that spike. In a sample request, you may see not only the SQL injection rule, but also additional contributing rules (other rules that may not be the primary reason that the request appears in a filtered Statistics view, but that have also fired on that request). Based on what you discover in the request payload or triggered rules, you return to Statistics view to refine your filter further.
Use Samples to build and validate your Statistics view and uncover contributing rules or data that may not appear there. Learn more
-
Click the All views drop-down to switch to other views, such as Multi-dimension, Bot, DDoS Traffic, User Risk/Account Protector, WAF, AI Bots, Alerts, Insights.
After selecting a view, you can customize its content by selecting a dimension from a given widget’s drop-down menu, adding filters to adjust the data, or by adding a new widget from the toolbar.To save your customized view, click Save as New View:
-

You can then find it under the All Views dropdown menu and set it as a default view. Your default view is displayed automatically each time you open Web Security Analytics. To remove the view, go to More actions menu and click Delete View.
- Set the parameters to get specific data.
- Click AI ASSISTANT or the Insights icon to get help and advanced analysis with AI assistant.
- Click
 to see the list of your alerts and create new ones. More on alerts.
 - To apply filters, click the Filters icon
 available in the toolbar. More on filters and how to view results by request or rule.
 - To display data for a dimension, click the Add widget icon
 and start typing or hover over an item on the list. Select whether you want to display your widget as a Table, Bar Chart, Line Chart or a Pie Chart. You can also repurpose any existing widget by switching its current dimension to another one from the drop-down list, and change its display option.
 - To copy the view link and share it with others, click the Copy View Link icon.
- Click the
 More actions menu in the toolbar to:
- Copy the View link to share with other users.
- Download the view as a PDF.
- Turn Human/Bot analysis on and off. When on, reports include human traffic that bypassed bot detections on transactional-endpoints only. To see this traffic, filter on bot score = 0.
- Select Logarithmic scale to spread data in all widgets based on order of magnitude. This allows both small and large values to remain visible at the same time. For example, you might see an average of only a few requests per 15 minutes, while short spikes reach much higher values. On a linear scale, these spikes dominate the graph and hide the lower traffic. When you switch to a Logarithmic scale, low traffic volumes are no longer compressed into a flat line. You can clearly see activity between spikes, even when traffic is relatively low. Once selected, the logarithmic scale setting is applied consistently across WSA (in the main chart and all widgets), so values remain comparable across all charts.

- Turn Evaluation mode on or off. Learn more
- Select the time interval for average requests.
- Select Indicators to display specific user or system events.
Understand your query response time in Web Security Analytics
After you set your report scope parameters in Web Security Analytics, the system processes your request and retrieves the relevant data. The time required to display results (query response time) depends on various factors, including:
- network conditions
- volume of processed data
- complexity of your queries
Typically, you can expect responses for standard queries and data retrieval within 7 seconds.
However, during peak usage or when dealing with intricate data analyses, response times might vary.
View releases and product updates
Releases & product updates indicators help you correlate traffic patterns with product changes by displaying markers directly on chart timelines in Web Security Analytics.
When enabled, the indicators show when releases, product updates, and other system changes occurred relative to your traffic data. Each indicator represents one or more events within the selected time range and appears above the timeline in supported charts.
The Release & product updates indicators provide critical context when investigating unexpected changes in traffic patterns. In many cases, issues such as increased false positives or false negatives can be linked to recent releases or system changes that are not otherwise easy to identify. By checking this information directly in Web Security Analytics, you can more quickly identify relationships between traffic anomalies and product updates, reduce investigation time, and better understand the impact of incremental or staged rollouts.
Enable Releases & product updates indicators
To display system events on the timeline:
- Open Web Security Analytics.
- Click More actions.
- Select Indicators and enable Releases & product updates.
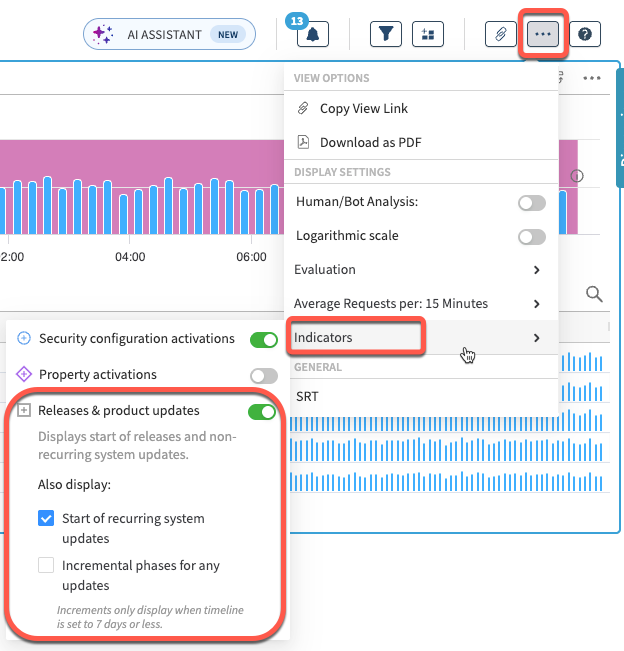
- You can also choose to display:
- Start of recurring system updates. Shows the start of regularly scheduled updates.
- Incremental phases for any updates. Displays rollout phases for updates. Incremental phases are displayed only when the selected timeline range is 7 days or less.
View event details
Once enabled, Releases & product updates appear as indicators above the chart timelines. Hover over a marker to see the number of events at that point in time.
You can also click an indicator to open a detailed view of system changes. The system changes panel includes:
- A list of releases and product updates associated with the selected indicator.
- Additional context about each system change.
You can also switch to an All events in timeline tab within the panel to see all releases and product updates across the selected time range.
Current data retention and query limits
In Web Security Analytics, sample log retention and query capabilities have evolved over time as the system has scaled. The current retention policy and query window are as follows:
- Sample logs are retained for 38 days and can be queried in time windows of up to 31 days at a time.
- The
ends with,containsandcase-insensitiveoperators are limited to a 24-hour query range. - All Web Security Analytics view supports querying data within a 31-day range, aligned with the current sample log retention period.
Updated 25 days ago