View the dashboard
The dashboard is the first thing you see when you access Cloud Wrapper in Akamai Control Center. It's comprised of several widgets that give you information on your configuration.

-
Use the drop-down to select your configuration.
-
Select a Date Range.
Now, you can use the widgets to view traffic and offload patterns, while monitoring overall cache usage.
The top-level widgets
These three widgets offer overall information for your configuration:
-
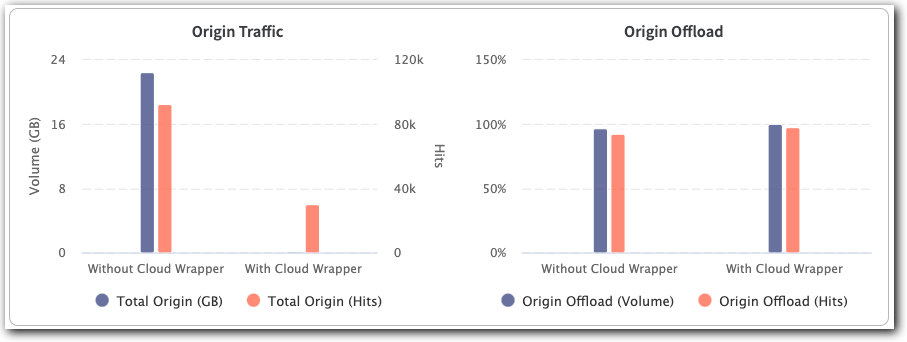
Origin Volume Improvement and Origin Hits Improvement. These two compare the Origin Volume and Origin Hits with and without Cloud Wrapper, for the properties configured with the selected footprint.
-
Average Fetches Per Object. This is the average number fetches per object to your origin server, for the selected footprint. We aim for approximately 1-1.5 for average fetches per object. (This is not a service level agreement.) If Average Fetches per Object increases, we will consider increasing your footprint. This is usually an indicator that your footprint's cache space isn't large enough to hold both your popular and your long-tail content.

The Cache Usage widget
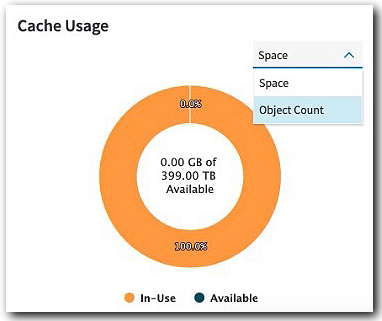
Review the Total, In-Use, and Available Space for your configuration.

Use the drop-down to select between Space used and the total Object Count.
Cloud Wrapper has a default object count limit of 10,000 objects/GB.
The Origin-related widgets
These two widgets offer the following information:
-
Offload (Volume). This shows the average percentage of bytes delivered from the Edge Servers as compared to the bytes delivered from your origin server for the filtered time range. This is calculated as: (Egress Bytes - Cloud Wrapper Bytes) / Egress Bytes \* 100.
-
Offload (Hits). This shows the average percentage of hits from the Edge Servers as compared to the hits from your origin server for the filtered time range. This is calculated as: (Egress Hits - Cloud Wrapper Hits) / Egress Hits \* 100.

The Footprint Analysis Report
The Footprint Analysis Report lets you visualize performance of your active configuration. You can adjust the footprint slider to see how modifying your currentCloud Wrapper space might benefit your workflow. Use this information to adjust your allocations, or contact your account representative to purchase additional space to meet your offload demands.
Additional considerations
- This Footprint Analysis Report widget shows your active Cloud Wrapper configuration. This is different from the Footprint Analysis Report that's generated to size your pre-Cloud Wrapper instance.
- A footprint analysis is only generated for on demand media or web content. Live media is not supported.
- A footprint analysis is generated once every 30 days.
- The property delivering your on demand media or web content needs at least 30 days of activity on Akamai's production network to provide reliable results for the analysis.

About report accuracy
Your past traffic patterns are used to generate these estimates and aren’t an exact predictor of future performance. If you change your workflow or traffic during the polling period, the accuracy of the analysis report can be affected.
Content with a TTL less than 1 day may provide inconsistent reporting curves.
Updated about 1 year ago
