TrafficPeak custom data source plugin for Grafana
Overview
TrafficPeak includes a Grafana installation that's preconfigured with a custom data source plugin. This guide describes macros, templates, ad hoc filters, and other convenience features of this plugin.
If you have a non-TrafficPeak-hosted instance of Grafana, connect it using the steps outlined in the Hydrolix data source plugin for Grafana documentation.
Query the data source
The query editor in Grafana supports SQL with syntax enhancements, such as macros and templates.
SQL query editor
The query editor uses the custom data source plugin to provide additional SQL capabilities:
- Autocompletion for databases, tables, columns, and SQL syntax
- Template variable and macro support
- Code formatting
Keyboard shortcut
- Cmd / Ctrl + Return: Run the current query
Macros
Use macros in your SQL queries to simplify syntax and add dynamic elements, such as date range filters.
| Macro | Description | Output example |
|---|---|---|
$__dateFilter(column) | Generates a condition to filter data, using the provided column, based on the panel's date range | date >= toDate('2022-10-21') AND date <= toDate('2022-10-23') |
$__timeFilter([column]) | Generates a condition to filter data based on the panel's time range in seconds. Accepts an optional column name. If no column is provided, the primary key is used automatically. | time >= toDateTime(1415792726) AND time <= toDateTime(1447328726) |
$__timeFilter_ms([column]) | Generates a condition to filter data based on the panel's time range in milliseconds. Accepts an optional column name. If no column is provided, the primary key is used automatically. | time >= fromUnixTimestamp64Milli(1415792726123) AND time <= fromUnixTimestamp64Milli(1447328726456) |
$__dateTimeFilter(dateColumn, timeColumn) | Combines $__dateFilter() and $__timeFilter() for filtering with separate date and time columns | $__dateFilter(dateColumn) AND $__timeFilter(timeColumn) |
$__adHocFilter | Replaced with a condition to filter data based on the applied ad hoc filters | statusCode = '200' |
$__fromTime | Replaced with the panel's start time, cast as DateTime | toDateTime(1415792726) |
$__toTime | Replaced with the panel's end time, cast as DateTime | toDateTime(1447328726) |
$__fromTime_ms | Replaced with the panel's start time, cast as DateTime64(3) (millisecond precision) | fromUnixTimestamp64Milli(1415792726123) |
$__toTime_ms | Replaced with the panel's end time, cast as DateTime64(3) (millisecond precision) | fromUnixTimestamp64Milli(1447328726456) |
$__interval_s | Replaced with the interval in seconds | 20 |
$__timeInterval([column]) | Calculates intervals based on panel width, useful for grouping data in seconds. Accepts an optional column name. If no column is provided, the primary key is used automatically. | toStartOfInterval(toDateTime(column), INTERVAL 20 second) |
$__timeInterval_ms([column]) | Calculates intervals based on panel width, useful for grouping data in milliseconds. Accepts an optional column name. If no column is provided, the primary key is used automatically. | toStartOfInterval(toDateTime64(column, 3), INTERVAL 20 millisecond) |
$__conditionalAll(condition, $templateVar) | Includes the provided condition only if the template variable doesn't select all values, defaults to 1=1 otherwise | condition or 1=1 |
This example shows a query with the $__timeFilter macro:
SELECT $__timeInterval(log_time) AS time, avg(cpu_usage) AS value
FROM logs
WHERE $__timeFilter()
GROUP BY time
ORDER BY time
Ad hoc filters
Use ad hoc filters to dynamically filter column values.
Grafana injects these filters into queries with the $__adHocFilter macro. You must include the macro in the WHERE clause:
SELECT $__timeInterval(log_time) AS time, avg(cpu_usage) AS value
FROM logs
WHERE $__timeFilter() AND $__adHocFilter()
GROUP BY time
ORDER BY time
The plugin ensures filters are applied only when valid for the selected table.
Limit ad hoc filter values
This plugin allows limiting ad hoc filter values based on a specified condition.
For example, if a dashboard only shows data from hosts with commercial domains, you can restrict the filter values using a condition like: host like '%.com'.
To apply the limit ad hoc filters, both the data source and the dashboard need additional configuration:
-
In Data source settings > Additional Settings, add values for the following:
- Ad hoc filter values query condition variable name: the name of a dashboard variable that defines a query condition to filter ad hoc filter values.
-
In the target dashboard, create a Constant (Const) variable with the name you set in Ad hoc filter values query condition variable name. For example, set its value to
host like %.com.
Empty and null values
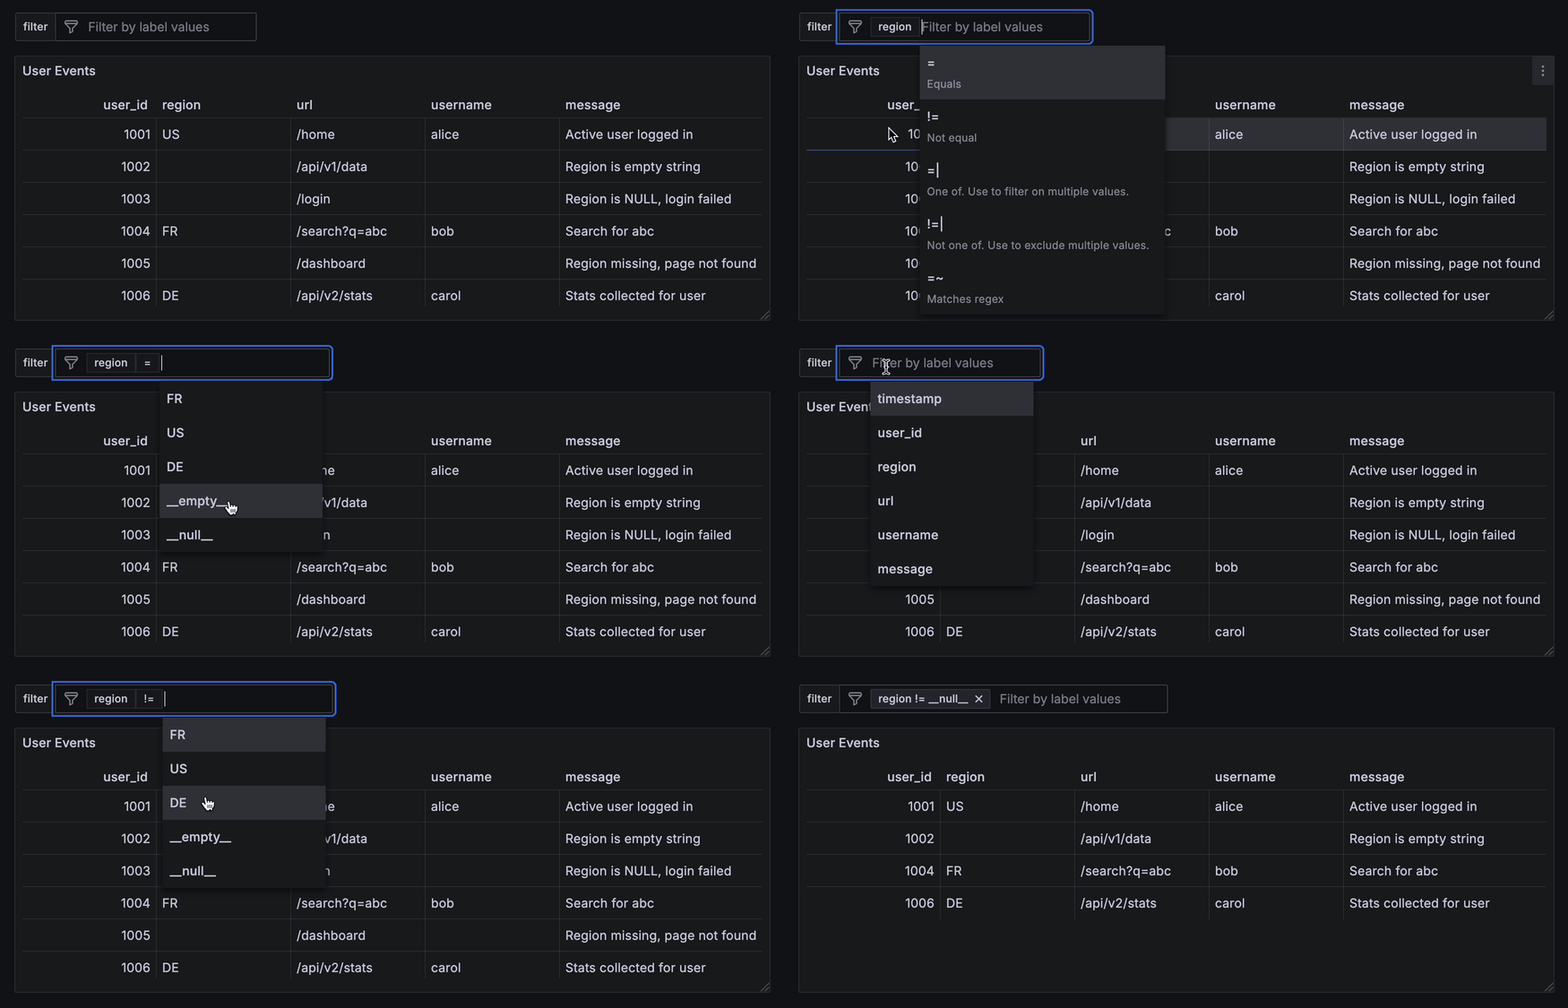
Ad hoc filters support two synthetic values to help identify and query rows with missing or blank data:
__null__: matches rows where the column value isNULL.__empty__: matches rows where the column value is an empty string.
These synthetic values appear in the ad hoc filter suggestions only if the underlying data contains NULL or empty strings for the selected column and dashboard time range.
The filters also match their corresponding literal values __null__ or __empty__.

Wildcards
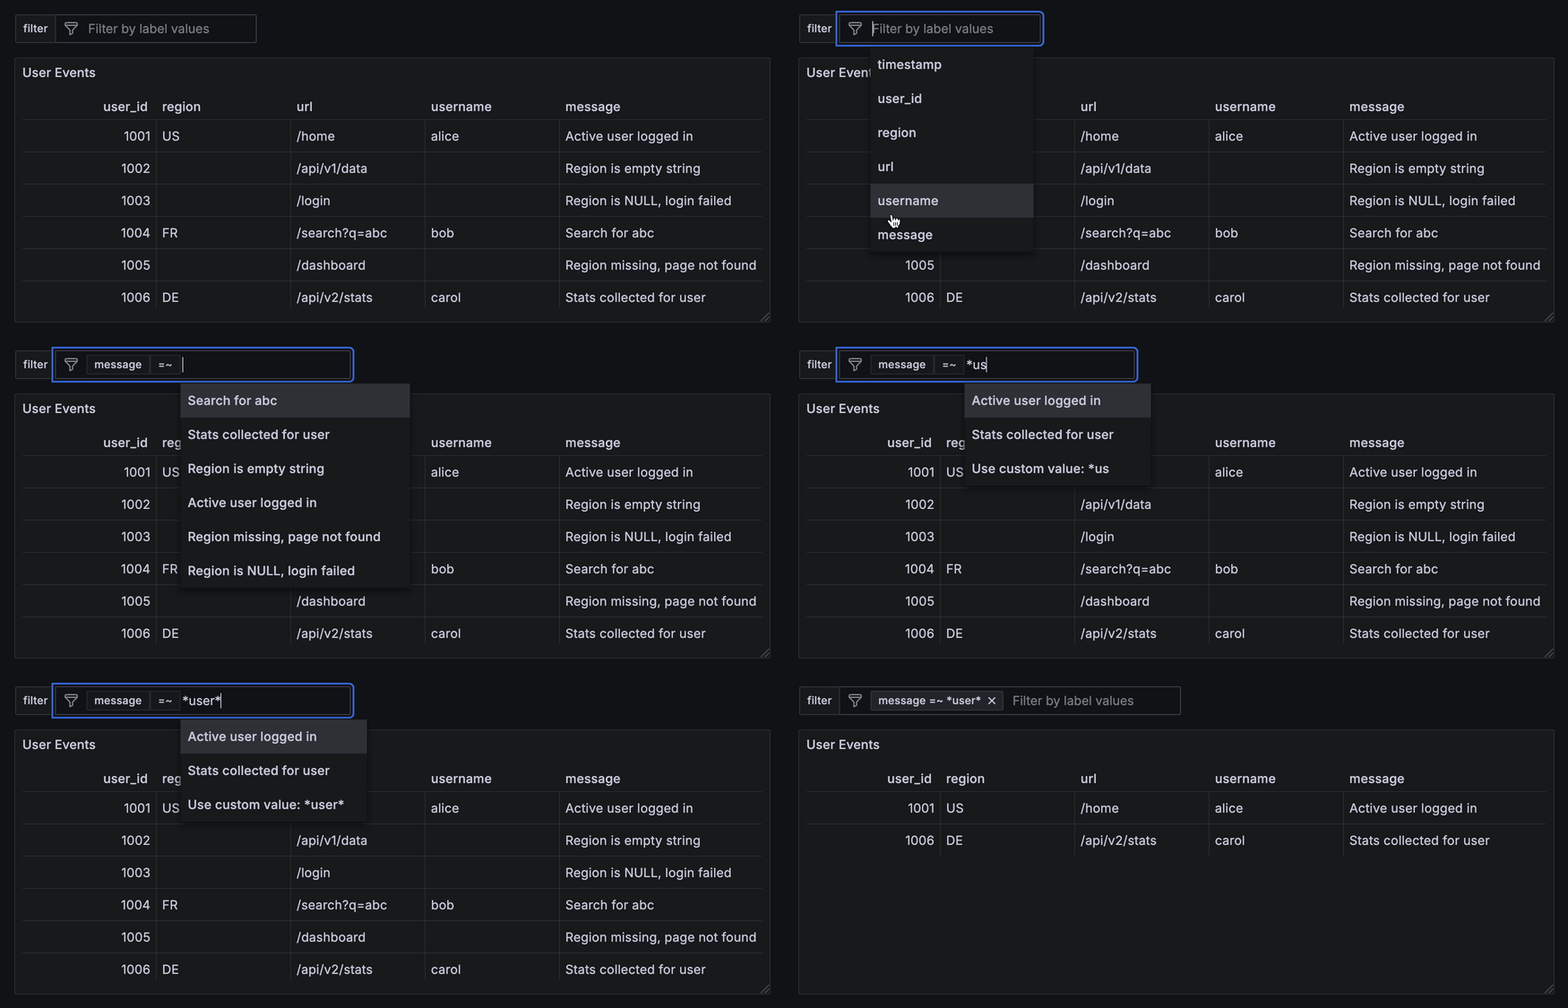
Ad hoc filters support wildcard filtering using the =~ and !~ operators. These operators match or exclude values based on simple patterns that include the * wildcard character. Full regular expressions aren't supported.
The * symbol matches any sequence of characters including an empty one. For example, *user* will match any value that contains the substring user, regardless of what comes before or after.
To match a literal asterisk (*), escape it with a backslash (\*). For example, to search for the exact string
*debug*, enter: \*debug\*.
To apply a wildcard filter:
- On the dashboard, click inside the filter field.
- Select the column you want to filter such as
message. - Choose the operator
=~or!~. - Type your full wildcard pattern. For example:
*user*. - Don't select any of the suggested values while typing.
- As you type, an option appears at the bottom of the suggestion list:
Use custom value: *user*. - Click this option to apply the filter.

Round timestamps
To control how time ranges are aligned, $from and $to timestamps can be rounded to the nearest multiple of the round value. This is set in the query editor.
A round value set in the query editor takes precedence and is always used. If no round is set in the query editor, the data source plugin falls back to the default round if it's configured and non-zero. If neither is set, or if the round value in the query editor is explicitly set to 0, no rounding occurs.
The supported time units for rounding are: ms (milliseconds), s (seconds), m (minutes), and h (hours).
Examples
| Default round | Query round | Effective round | Input timestamp | Rounded timestamp |
|---|---|---|---|---|
5m | not set | 5m | 10:07:20 | 10:05:00 |
5m | 1m | 1m | 09:02:30 | 09:03:00 |
| not set | not set | not applied | 08:01:23 | 08:01:23 |
5m | 0 | not applied | 07:45:50 | 07:45:50 |
Template variables
TrafficPeak queries fully support Grafana's template variables to create dynamic and reusable dashboards.
For more details about template variables, see Grafana’s add variables documentation.
Updated about 2 months ago
