Dashboards overview
TrafficPeak provides a standardized set of dashboards in your Grafana configuration. They serve common use cases from TrafficPeak customers.
Benefits include:
-
Flexible queries
The dashboards automatically switch the underlying data source from raw log data to summary tables for greater speed, while retaining the ability to quickly drill down into the row-level details. -
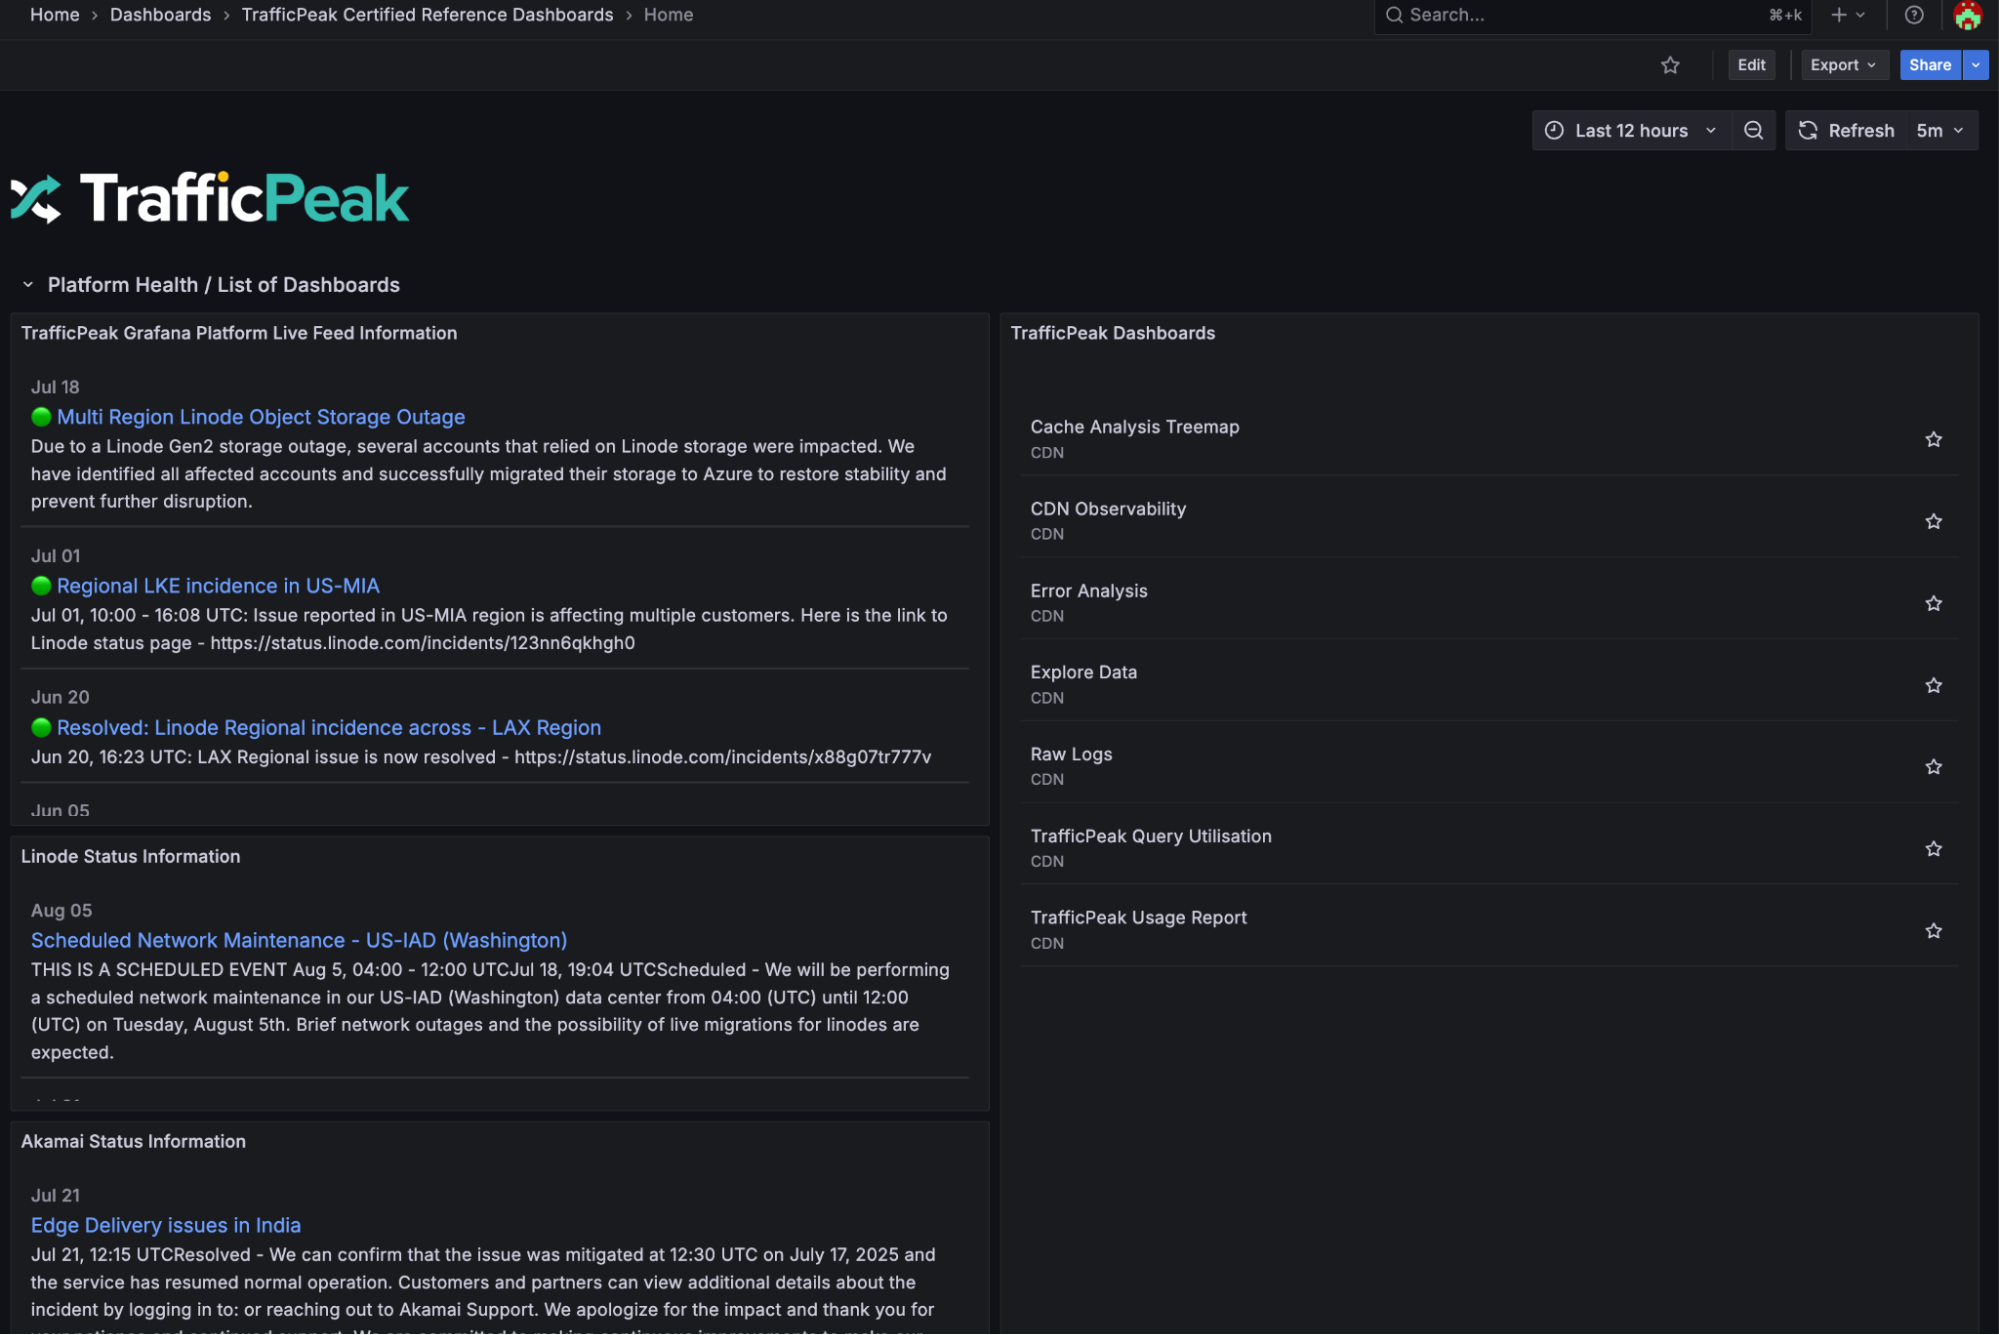
TrafficPeak Operational Status
A home page dashboard observes TrafficPeak infrastructure to show issues in Akamai and Linode services. -
Ad Hoc Filtering
A number of dashboards provide ad hoc filtering that simplifies the variables displayed at the top of the dashboard and enables an interactive filtering process. Choose your filters by selecting the filter box and typing.
See what's new in the latest dashboards by following the TrafficPeak dashboard release notes.
Dashboard summaries
Home Dashboard
The Home Dashboard provides insight into operational status displaying feeds for TrafficPeak, Linode and Akamai. Determine if operational issues are currently impacting the performance of your TrafficPeak dashboards and navigate to the rest of the dashboards, documentation, and support.
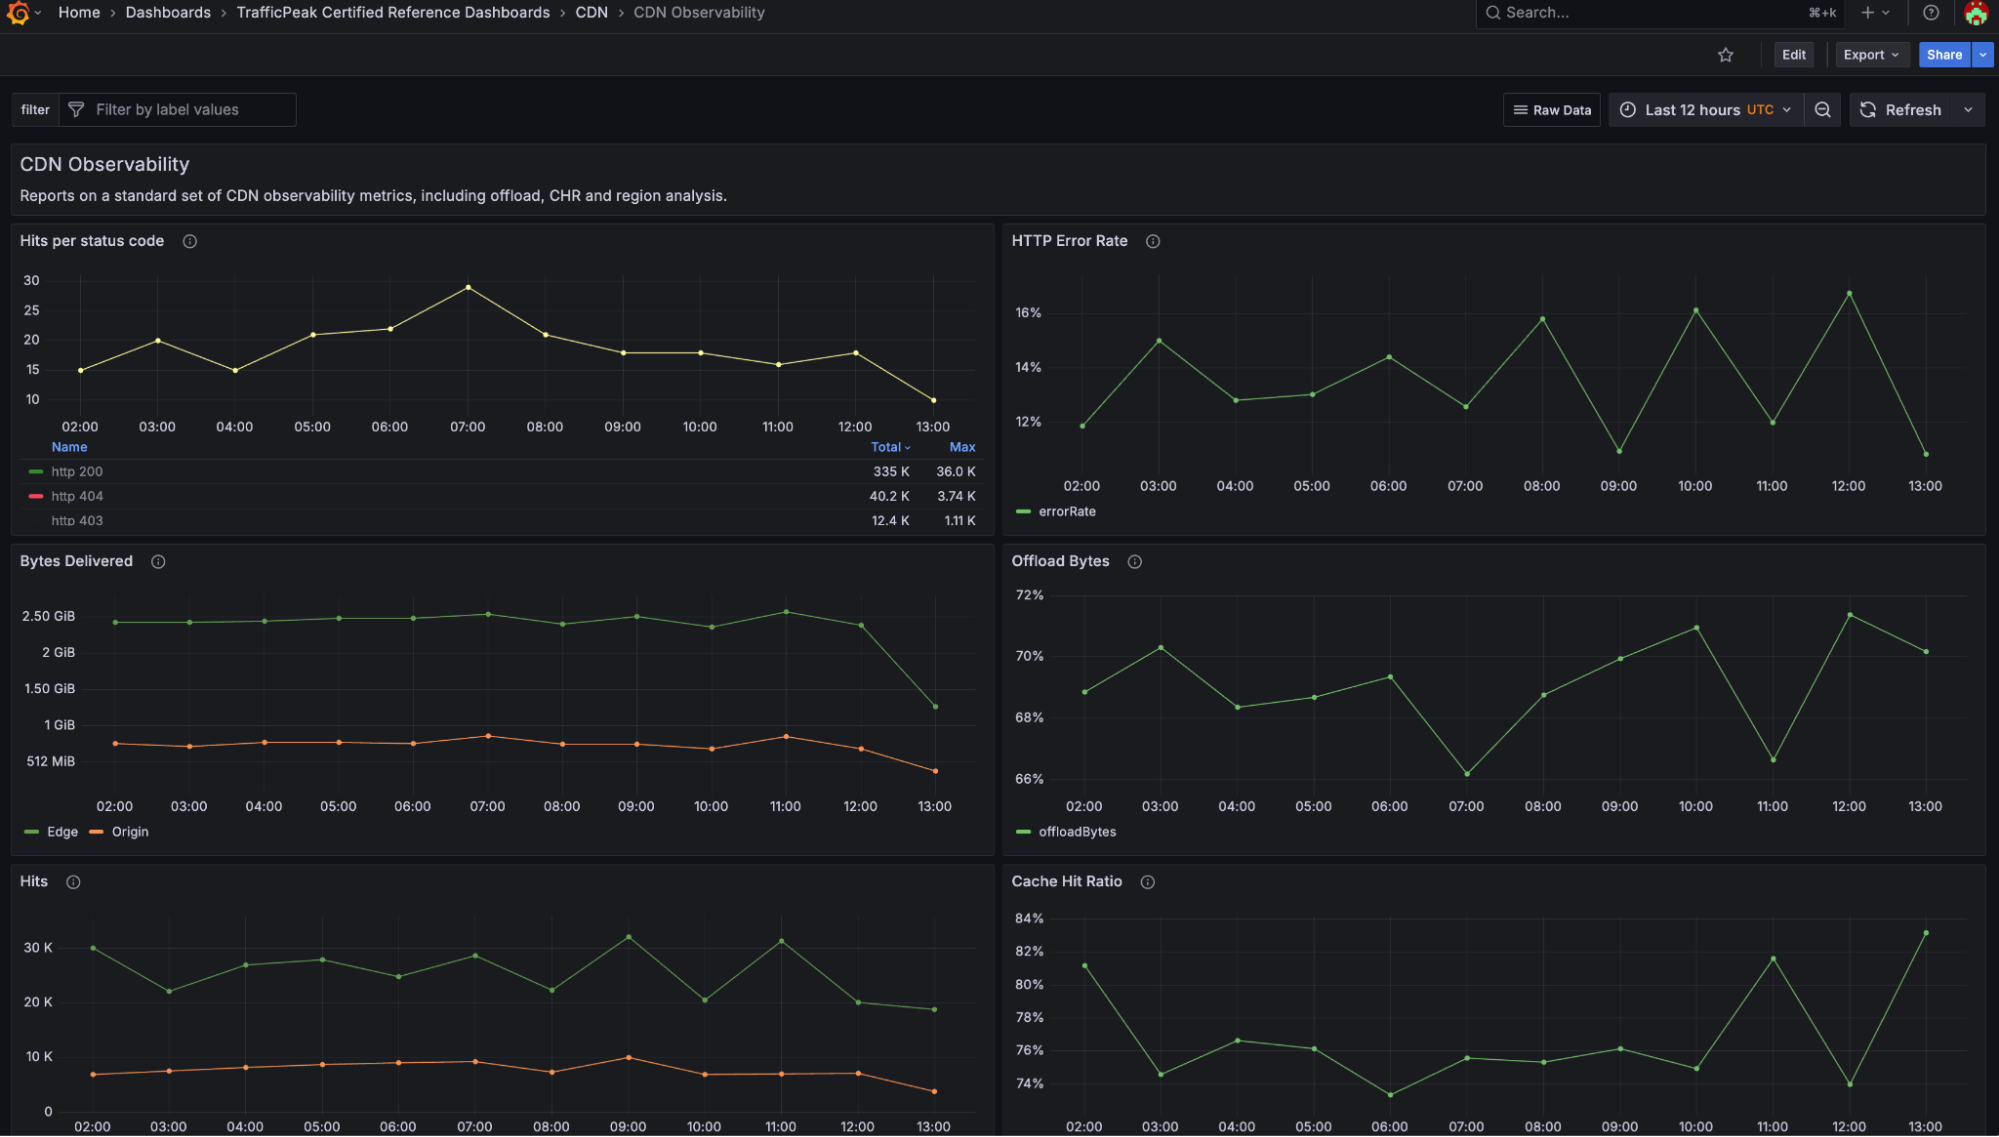
CDN Observability Dashboard
View the standard set of CDN observability metrics, like cache hit ratio, offload, and region analysis with the CDN Observability Dashboard. Gain observability into CDN logs to determine your end users’ experience and to identify any performance issues or errors they might be experiencing.
The dashboard provides dynamic table selection for efficiency, switching tables based on the duration of the selected time range.
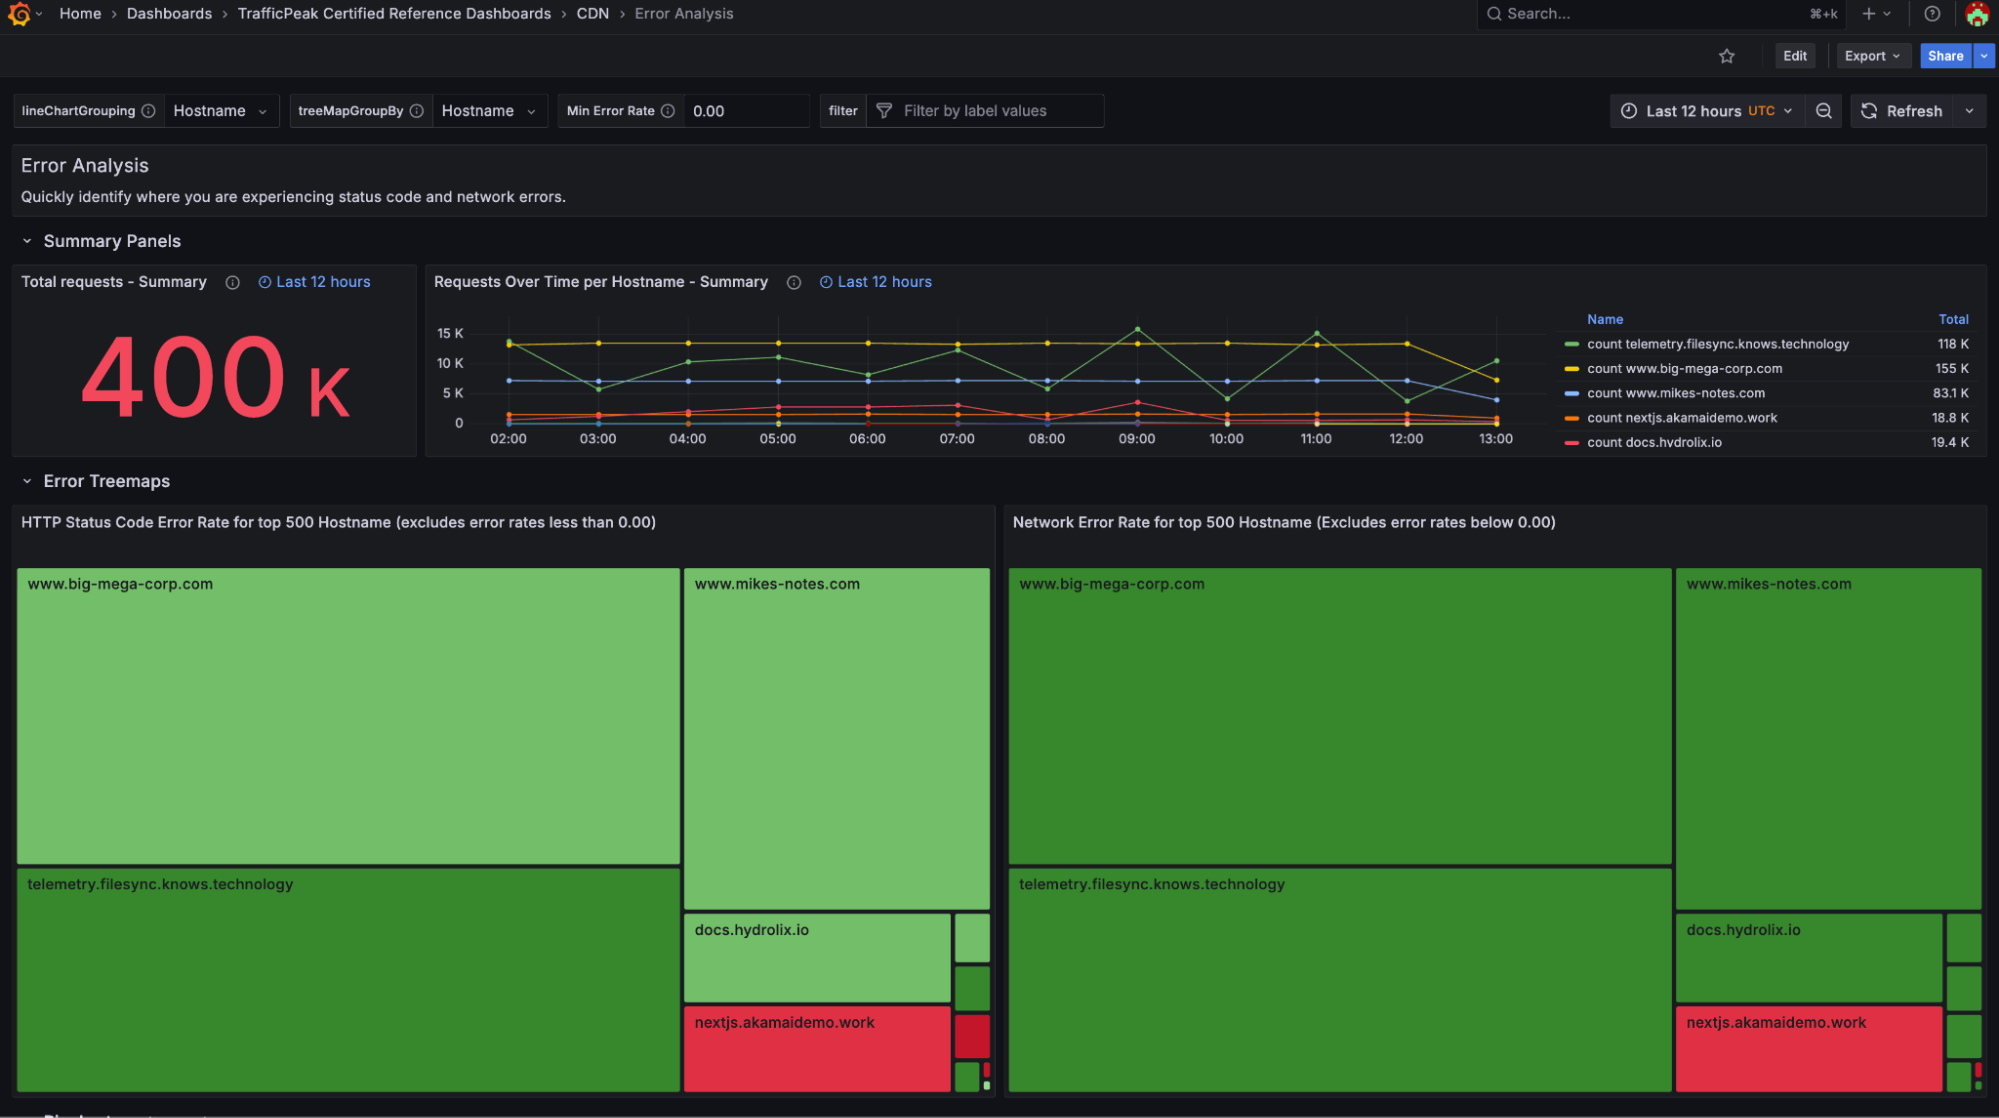
Error Analysis Dashboard
Identify where customers are experiencing status code and network errors.
This dashboard uses dynamic table selection for improved performance across longer time ranges.
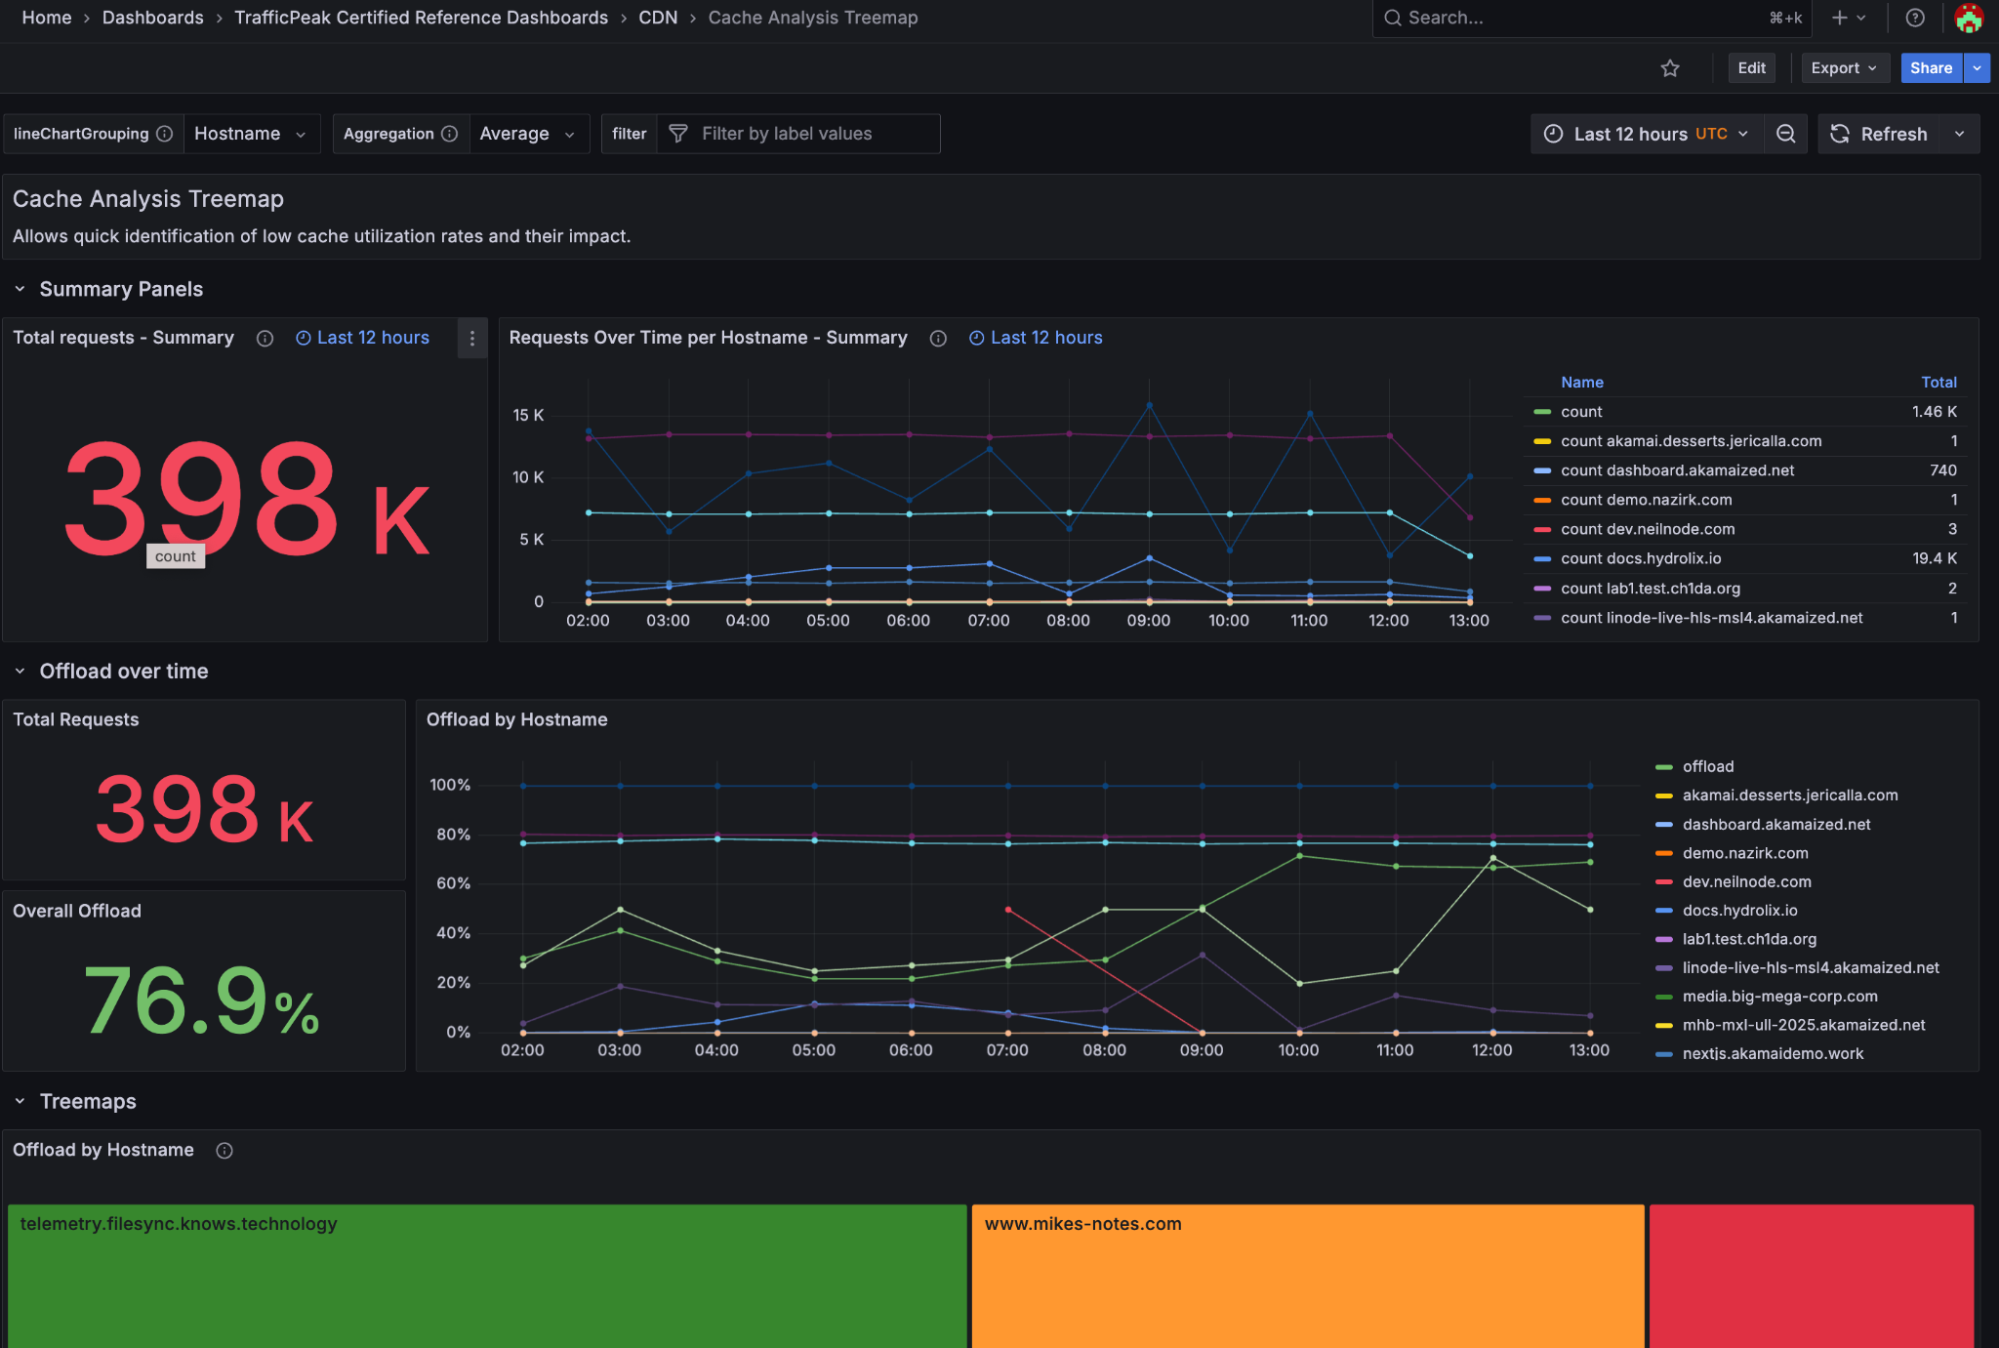
Cache Analysis Treemap Dashboard
Locate low cache utilization rates and their impact. This dashboard includes views of origin offload over time, by hostname, content-type, and resource. View the effectiveness of CDN delivery and prioritize cache offload optimizations.
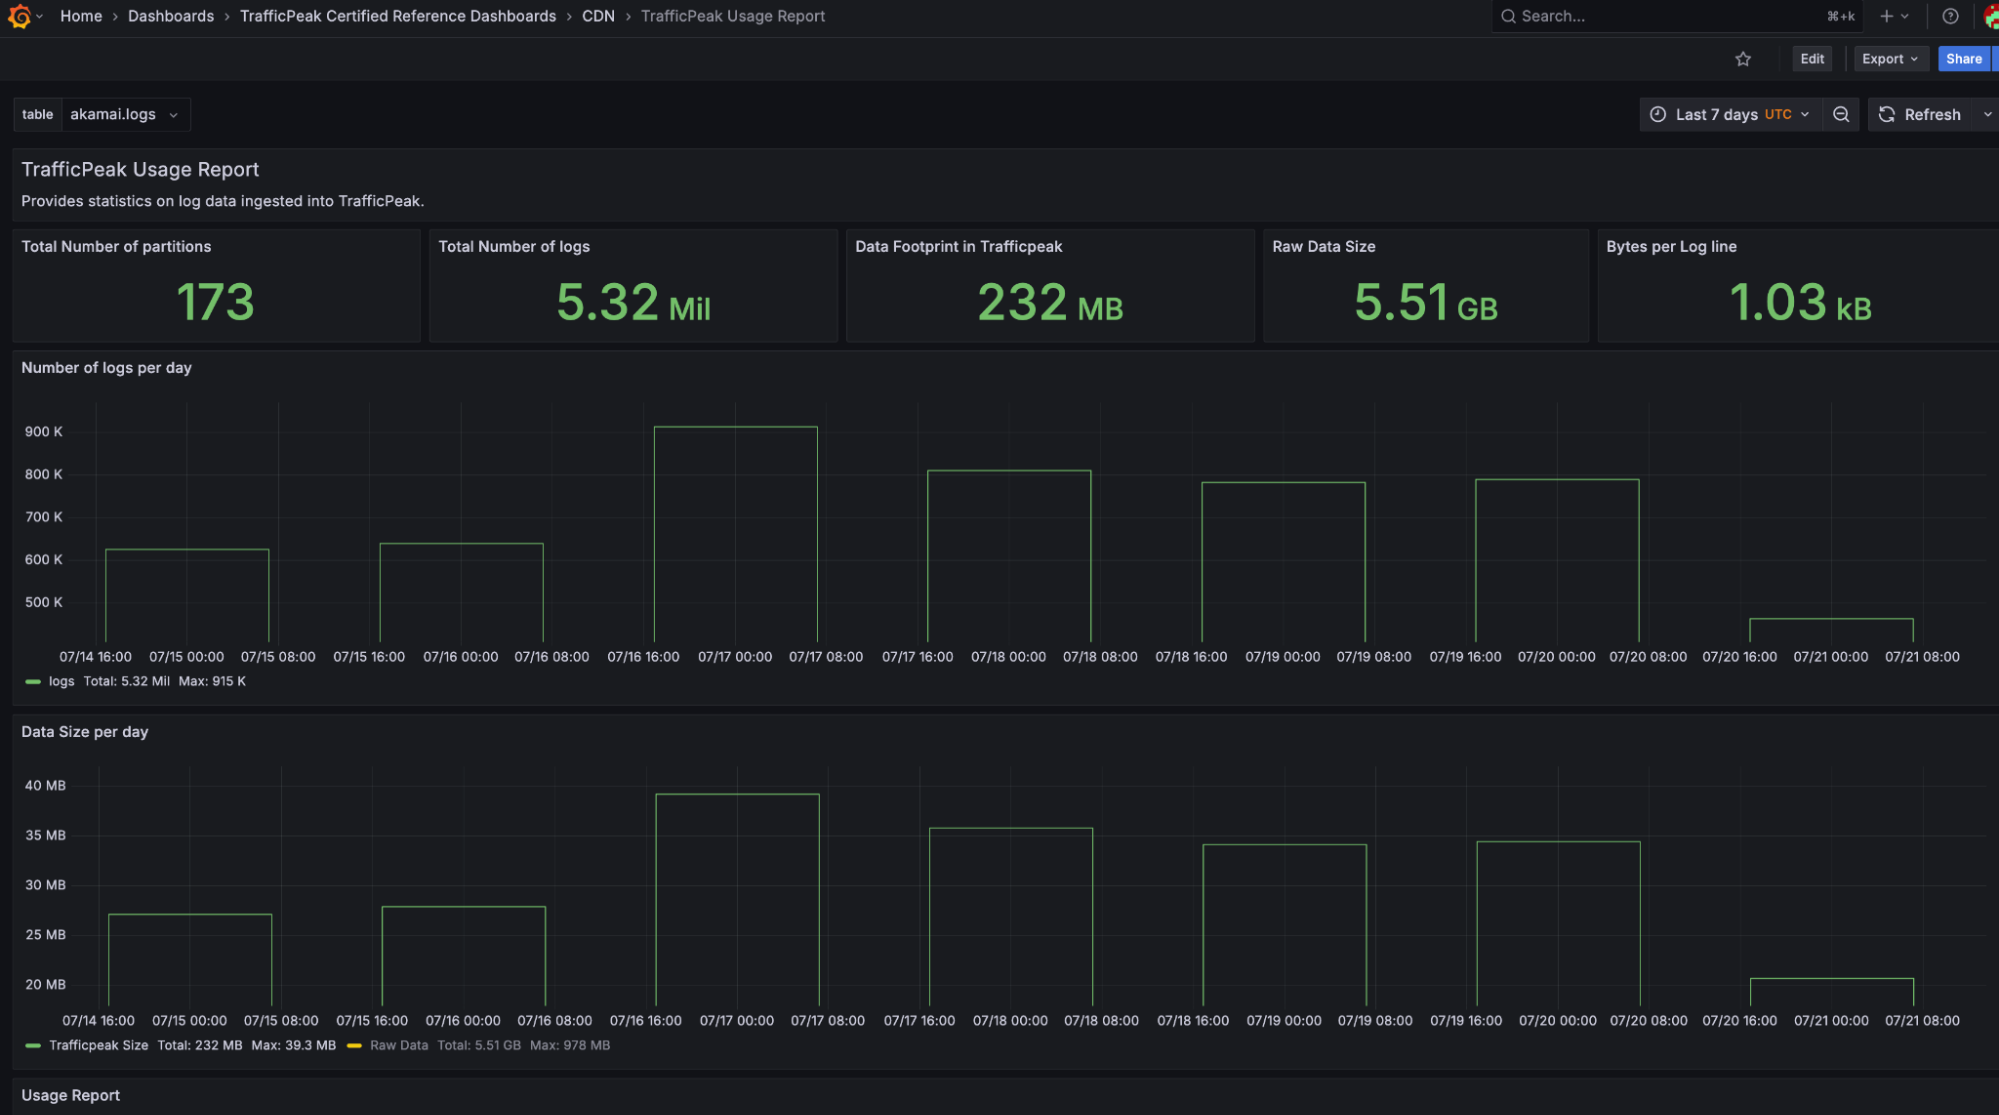
TrafficPeak Usage Report Dashboard
See monthly utilization statistics on ingested data to understand billing and overage charges.
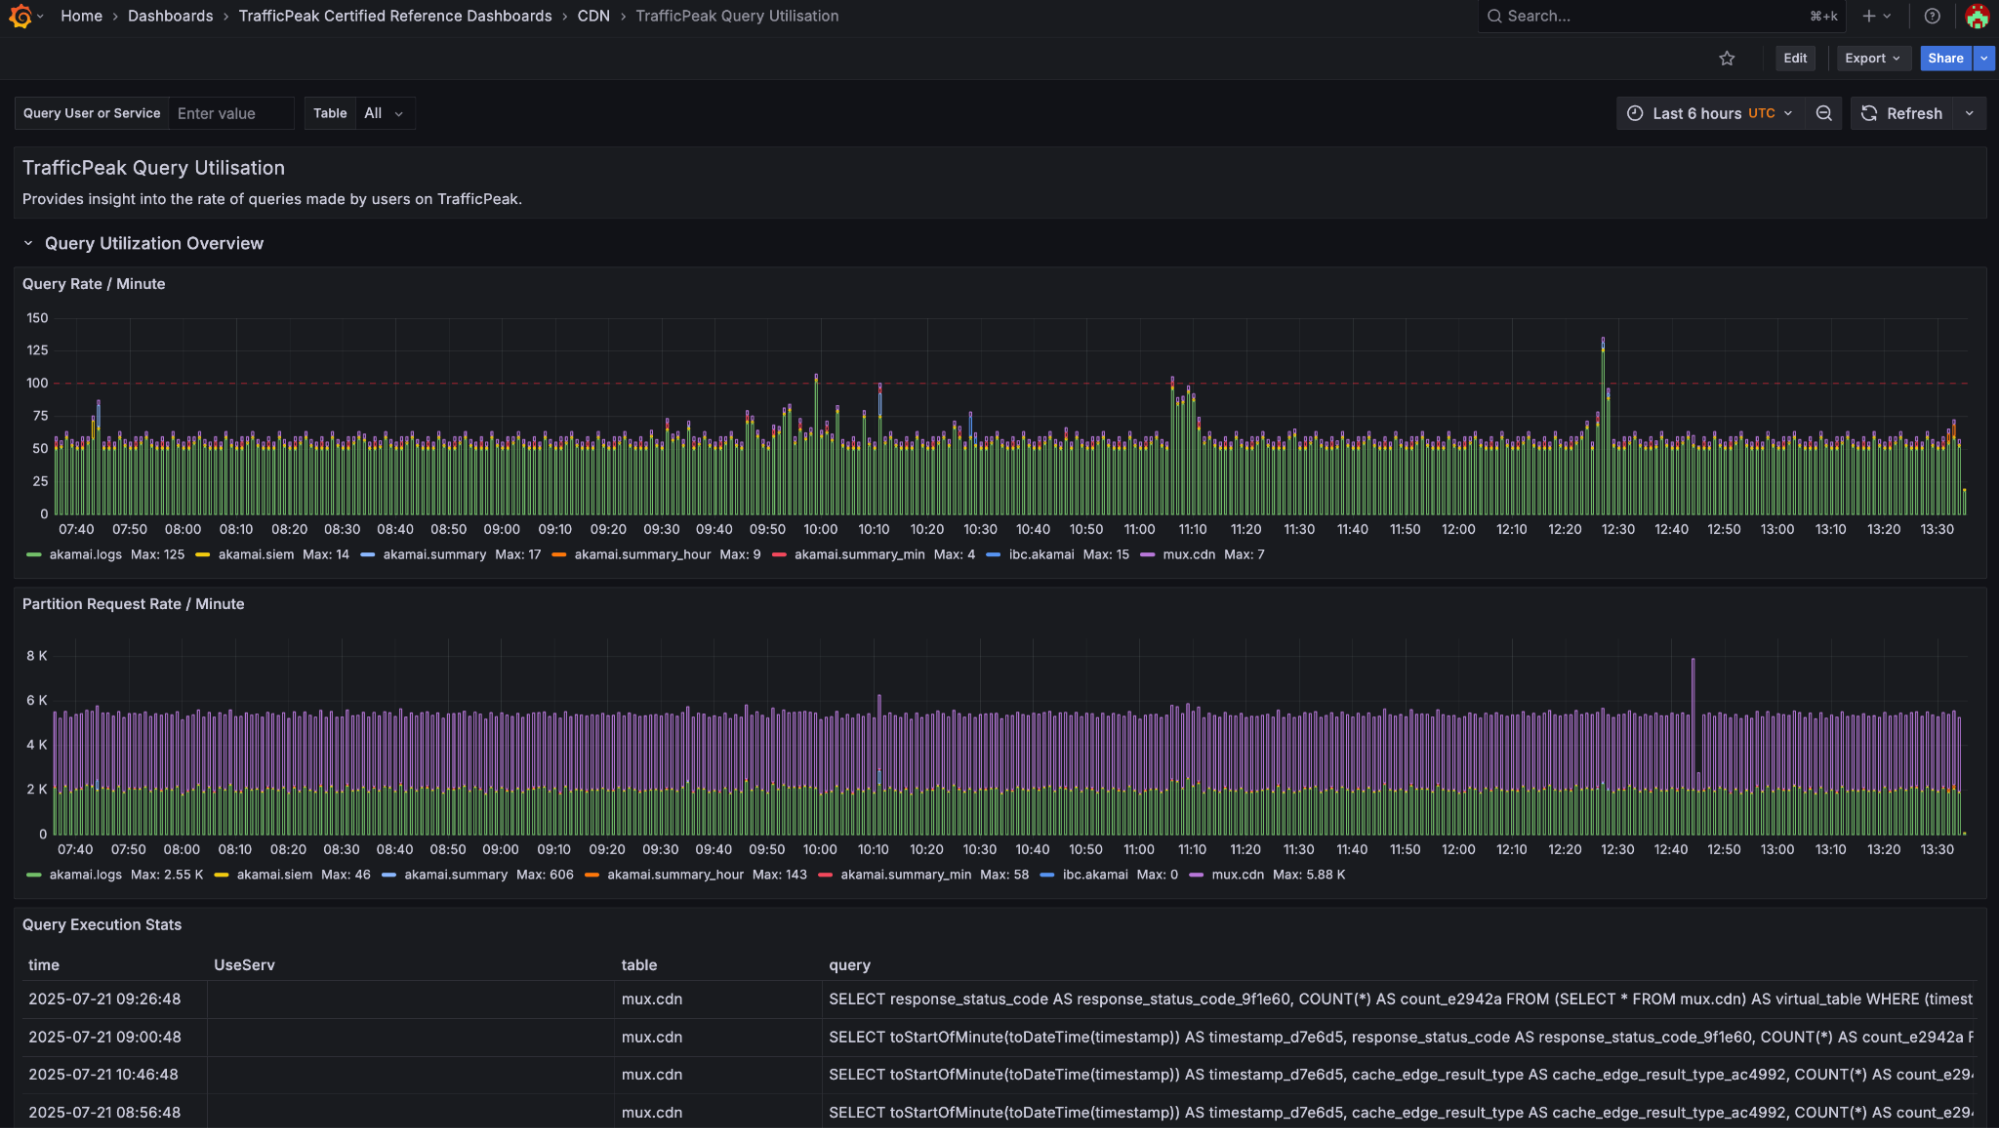
TrafficPeak Query Utilization Dashboard
If you have a dedicated account, view the query rate, one of the metrics used to size and bill for TrafficPeak consumption. Understand whether you may be bumping into query scaling limitations, and learn which users are generating queries against TrafficPeak.
Explore Data Dashboard
Learn the schema of your ingested data to help you build your own dashboards. The time range is fixed to use the last six hours of available raw log data; changing the time range via the Grafana UI will not have any effect.
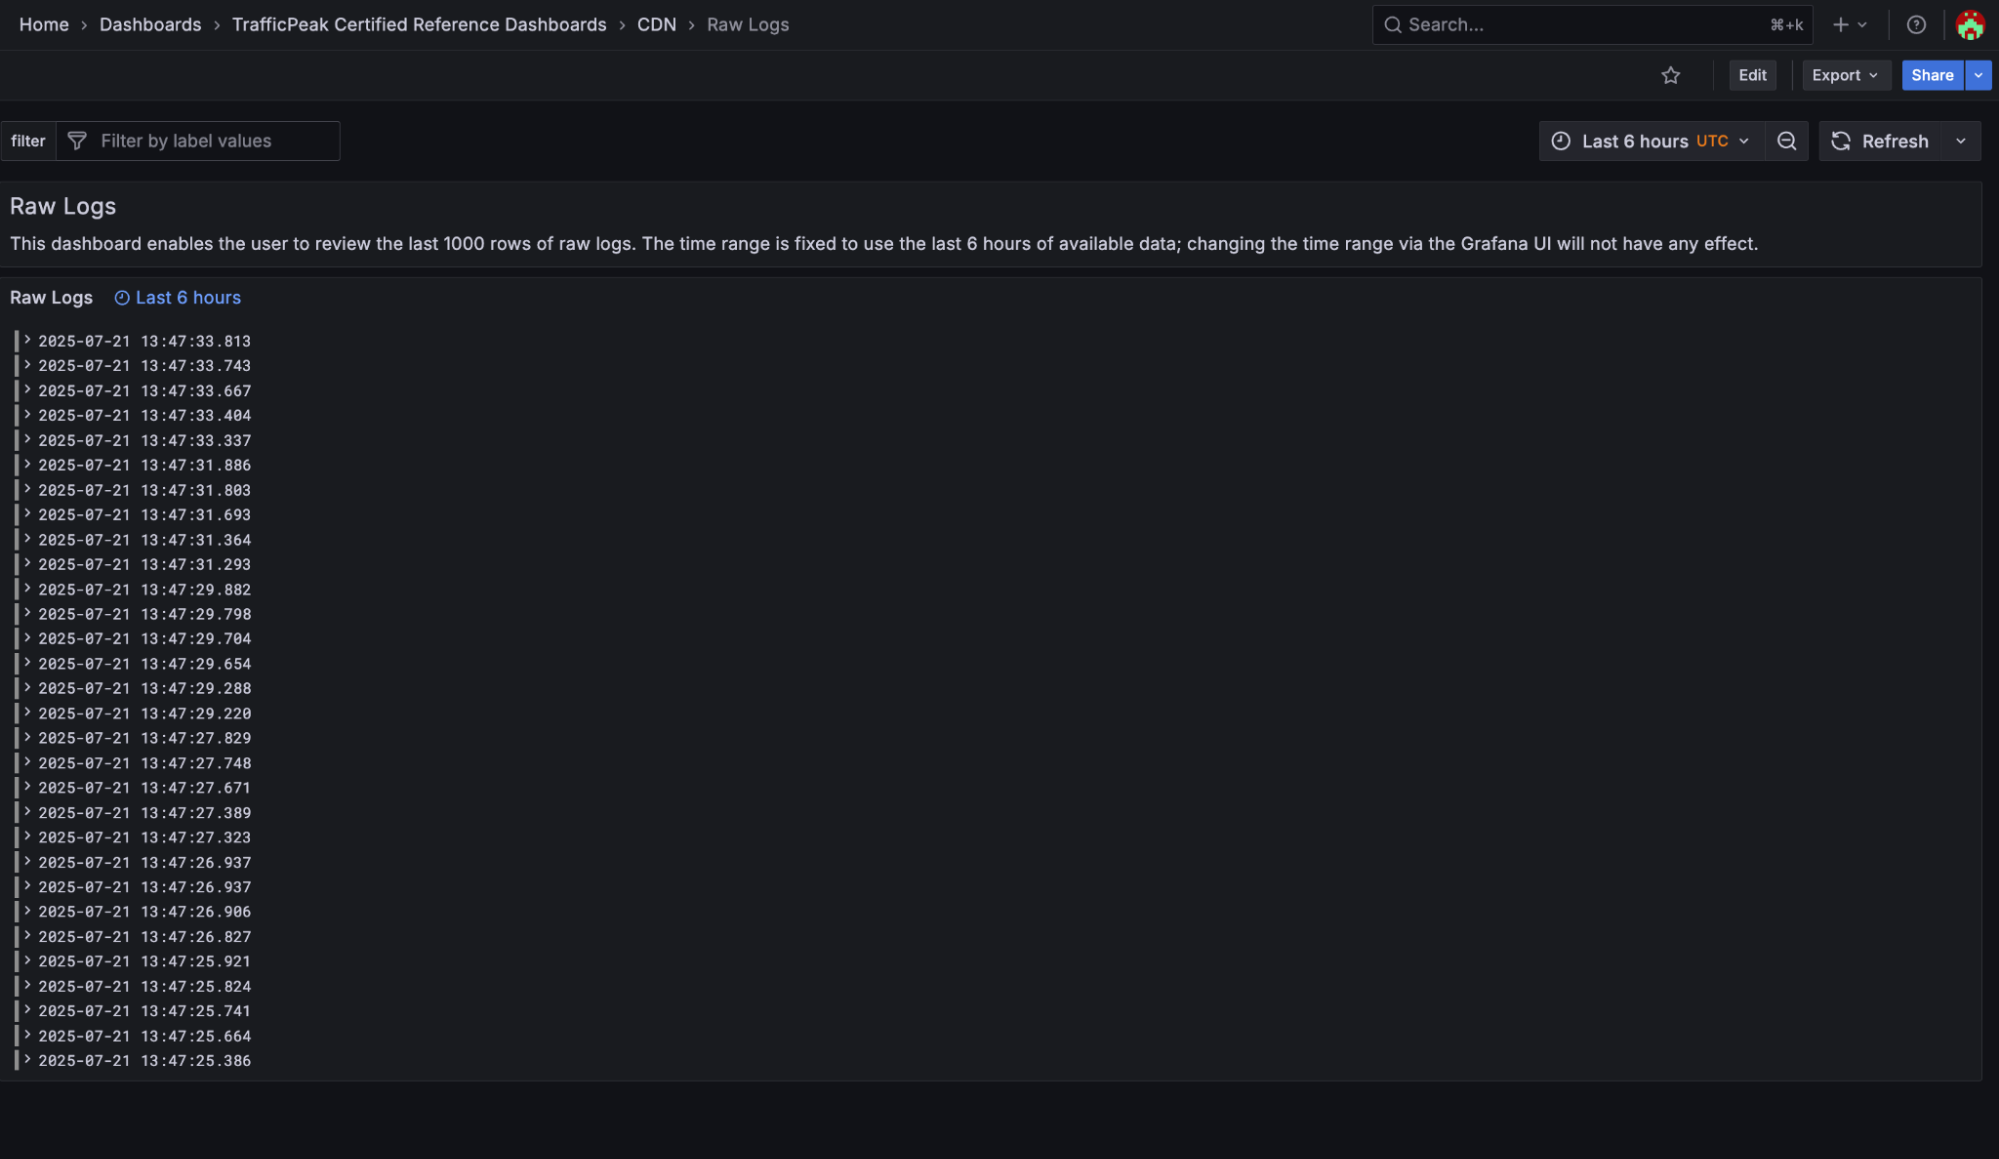
Raw Logs Dashboard
Review the last 1000 rows of raw logs over the previous six hours with the Raw Logs Dashboard. This is useful for real-time events or to explore sample ingested data while learning how to use TrafficPeak.
The time range is fixed to use the last six hours of available data; changing the time range in the Grafana UI will not have any effect. For queries with longer time ranges or with specific raw log lookback outside of the selected six hours, use the CDN Observability dashboard, which provides more flexible navigation and better performance.
Hydrolix Grafana Plugin and Ad-hoc Filtering
The new dashboards also utilize the Hydrolix Grafana Plugin, which provides clear error messages, supports ad hoc filters, and provides query caching.
Updated 4 months ago