Run reports
After your site’s been live for a while, you can review various data on its usage. Here, we’ll show you how to generate a traffic report using Akamai’s reporting tools.
Use Control Center
You can view various reports for your site, complete with graphs and statistical data. Let's run a report that shows the various HTTP responses that were sent for requests for your site over a specific range of time.
-
Access Akamai Control Center.
-
Log in using your primary admin user.
-
From the Control Center menu, click Analytics & monitor > Reporting > Traffic Reports > Traffic by Hostname.
-
Set the following Select filters options:
- Date range. Adjust the date, time, and time zone to your preferred date range.
- Customer data. Set Groups to your primary group and Properties to the name you set for your Ion property.
- CP codes. Look for the numeric identifier for the CP code you set in the Traffic reporting sub-rule in your Ion property, and select it.
-
Leave all other options at their default and click Apply.
Review data in the report
This report includes:
-
Key Performance Indication (KPI) data. This is the top set of information in the report. It shows the percentage of requests that were served from edge servers without needing to contact your origin server. It also shows the total number of requests ("hits") that were resolved by Akamai edge servers as well as the total number of requests that edge servers had to make to your origin server to get content.
-
Widgets. These are all of the graphs you see in the report. You can:
- Mouse over the graph. You'll see specific data for that point in time.
- Click items in the key. This filters what's displayed in the graph.
- Download the data as a csv file. Click
 to get a comma-separated values file comprised of the data in the widget.
More user interface reports
What's above is just one of the reports you can access to view data for your site. You can also select any of these from the Report drop-down for your Ion property:
| Report | Description |
|---|---|
| Origin Performance | This report shows performance characteristics observed by Akamai edge servers when making requests to your origin server. |
| Traffic by Browser & OS | This report provides information about what browser types and operating systems are generating traffic. |
| Traffic by Hostname | This report shows key traffic stats, in near real-time, by dimensions that are relatable to your business. This report also offers edge metrics by requested hostname. |
| Traffic by Geography | This report returns traffic data based on the country or area where requests originated for your site or app. |
| Traffic - Carbon Calculator | This report helps you get an idea of the emissions your Akamai traffic may be creating and the efficiency Akamai is applying to reduce these emissions. |
| URL Responses | This report delivers HTTP response data by URL. HTTP URL data is stored only for URLs with at least 50 hits per day. |
| URL Traffic | This report delivers traffic data by URL. Data can be viewed based on the number of hits or bytes transferred. |
Use an API
Akamai also lets you create reports using the Reporting API. Use this API to generate a traffic report based on the various HTTP responses sent for requests for your site over a specific range of time.
- List reports and store the
nameand the currentversionof the desired report. - With the proper data stored, you can generate the report.
See delivery/traffic/current in our API documentation under Available reports.
There are more API reports
This is just one of the APIs you can use to generate reports for your site. Have a look at the Reporting API documentation for a list of the other reports available for Ion and Ion OTA Updates.
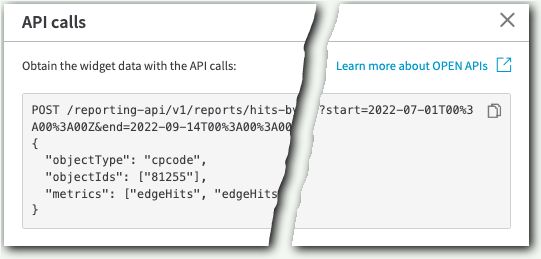
Get APIs from the UIYou can use the Reporting tool in Control Center to generate a report, and then click the API calls icon (
) to get the exact syntax you need to run the same operation in the Reporting API.
Updated 22 days ago