Analyze data shown in a report
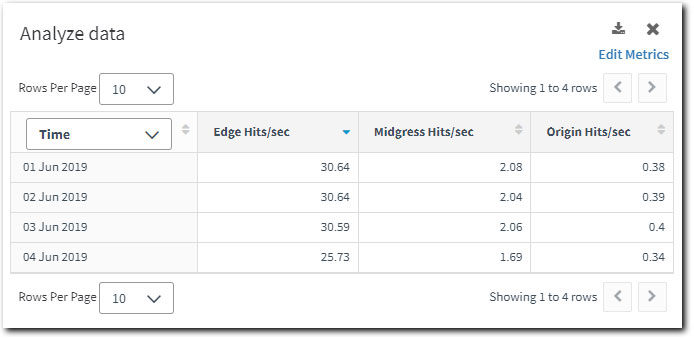
Use widgets within a report to analyze, customize and expand the data presented, as shown in this example:

To analyze data shown in a report:
-
Click the analyze icon
 , if present, to access the Analyze data UI.
 -
You can adjust the date/time range for a report and filters.
-
Each widget has a default metrics. In the example above, the defaults are Edge Hits/sec, Midgress Hits/sec, and Origin Hits/sec. You can click Edit Metrics to add or remove metrics from the report.
-
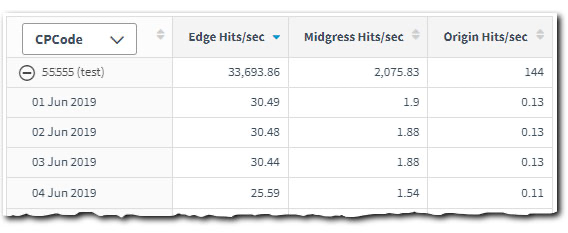
Each widget defaults to Time as its primary dimension. You can click the menu in the first header column to change the dimension. For example, you might select the CPCode dimension to display data based on CP code in the table. Results are displayed based on how you've set up filtering for the full report.
View root dimensions and time
Click the plus icon ![]() to expand the root dimension and display time information for each specific dimension entry, as shown in this example:
to expand the root dimension and display time information for each specific dimension entry, as shown in this example:

Click the minus icon ![]() to return to the custom dimension view.
to return to the custom dimension view.
In addition to the plus icon, you can also click the dimension entry name and select Time.
Download report data
To download a comma-separated values (CSV) file of the report data, click the download icon ![]() .
.
Return to full reports view
Click X in the top right to close the analyze widget view and return to full report view.

Updated about 2 years ago
